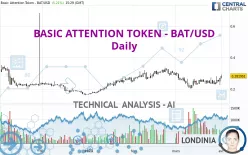
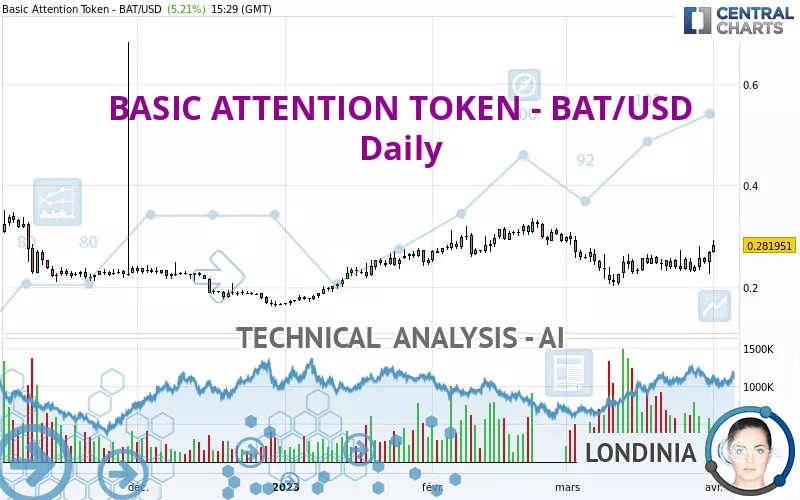
BASIC ATTENTION TOKEN - BAT/USD - Daily - Technical analysis published on 04/01/2023 (GMT)
- 190
- 0
Click here for a new analysis!
- Timeframe : Daily
- - Analysis generated on
- Status : TARGET REACHED
Summary of the analysis

Additional analysis
Quotes
The BASIC ATTENTION TOKEN - BAT/USD rating is 0.281951 USD. On the day, this instrument gained +5.21% and was traded between 0.265913 USD and 0.291820 USD over the period. The price is currently at +6.03% from its lowest and -3.38% from its highest.A bullish opening was detected by the Central Gaps scanner. Buyers are trying to impose a bullish momentum in the very short term.
Bullish opening
Type : Bullish
Timeframe : Openning
So that you have an overall view of the price change, here is a table showing the variations over several periods:
Abnormal volumes
Timeframe : 20 days
Technical
Technical analysis of this Daily chart of BASIC ATTENTION TOKEN - BAT/USD indicates that the overall trend is bullish. 78.57% of the signals given by moving averages are bullish. The overall trend is reinforced by the strong bullish signals from short-term moving averages. An assessment of moving averages reveals several bullish signals that could impact this trend:
Bullish trend reversal : Moving Average 50
Type : Bullish
Timeframe : Daily
Bullish price crossover with Moving Average 50
Type : Bullish
Timeframe : Daily
Bullish price crossover with adaptative moving average 50
Type : Bullish
Timeframe : Daily
An assessment of technical indicators shows a strong bullish signal.
Caution: the Central Indicators scanner currently detects an excess:
CCI indicator is overbought : over 100
Type : Neutral
Timeframe : Daily
Pivot points : price is over resistance 1
Type : Neutral
Timeframe : Weekly
Parabolic SAR indicator bullish reversal
Type : Bullish
Timeframe : Daily
Aroon indicator bullish trend
Type : Bullish
Timeframe : Daily
MACD indicator is back over 0
Type : Bullish
Timeframe : Daily
No signals are given by Central Patterns, a market scanner specialised in chart patterns, resistances and supports.
The Central Candlesticks scanner which studies Japanese candlesticks did not detect anything.
| S3 | S2 | S1 | Price | R1 | R2 | R3 | |
|---|---|---|---|---|---|---|---|
| ProTrendLines | 0.209207 | 0.237648 | 0.257416 | 0.281951 | 0.289362 | 0.308850 | 0.338156 |
| Change (%) | -25.80% | -15.71% | -8.70% | - | +2.63% | +9.54% | +19.93% |
| Change | -0.072744 | -0.044303 | -0.024535 | - | +0.007411 | +0.026899 | +0.056205 |
| Level | Major | Minor | Intermediate | - | Minor | Minor | Intermediate |
Pivot points can also be used to set your price objectives. Here is the price situation in relation to pivot points:
| Pivot points | S3 | S2 | S1 | PP | R1 | R2 | R3 |
|---|---|---|---|---|---|---|---|
| Standard | 0.193763 | 0.209919 | 0.238949 | 0.255105 | 0.284135 | 0.300291 | 0.329321 |
| Camarilla | 0.255554 | 0.259696 | 0.263838 | 0.267980 | 0.272122 | 0.276264 | 0.280406 |
| Woodie | 0.200201 | 0.213138 | 0.245387 | 0.258324 | 0.290573 | 0.303510 | 0.335759 |
| Fibonacci | 0.209919 | 0.227180 | 0.237844 | 0.255105 | 0.272366 | 0.283030 | 0.300291 |
| Pivot points | S3 | S2 | S1 | PP | R1 | R2 | R3 |
|---|---|---|---|---|---|---|---|
| Standard | 0.179501 | 0.205699 | 0.220807 | 0.247005 | 0.262113 | 0.288311 | 0.303419 |
| Camarilla | 0.224555 | 0.228341 | 0.232128 | 0.235914 | 0.239700 | 0.243487 | 0.247273 |
| Woodie | 0.173955 | 0.202927 | 0.215261 | 0.244233 | 0.256567 | 0.285539 | 0.297873 |
| Fibonacci | 0.205699 | 0.221478 | 0.231226 | 0.247005 | 0.262784 | 0.272532 | 0.288311 |
| Pivot points | S3 | S2 | S1 | PP | R1 | R2 | R3 |
|---|---|---|---|---|---|---|---|
| Standard | 0.103959 | 0.152982 | 0.210481 | 0.259504 | 0.317003 | 0.366026 | 0.423525 |
| Camarilla | 0.238687 | 0.248451 | 0.258216 | 0.267980 | 0.277745 | 0.287509 | 0.297274 |
| Woodie | 0.108197 | 0.155101 | 0.214719 | 0.261623 | 0.321241 | 0.368145 | 0.427763 |
| Fibonacci | 0.152982 | 0.193673 | 0.218813 | 0.259504 | 0.300195 | 0.325335 | 0.366026 |
Numerical data
The following is the status of the technical indicators and moving averages at the time of publication of this technical analysis:
| RSI (14): | 58.57 | |
| MACD (12,26,9): | 0.0005 | |
| Directional Movement: | 12.130366 | |
| AROON (14): | 7.142857 | |
| DEMA (21): | 0.250716 | |
| Parabolic SAR (0,02-0,02-0,2): | 0.226074 | |
| Elder Ray (13): | 0.025208 | |
| Super Trend (3,10): | 0.290229 | |
| Zig ZAG (10): | 0.280995 | |
| VORTEX (21): | 1.1195 | |
| Stochastique (14,3,5): | 67.62 | |
| TEMA (21): | 0.256588 | |
| Williams %R (14): | -16.10 | |
| Chande Momentum Oscillator (20): | 0.034729 | |
| Repulse (5,40,3): | 13.4866 | |
| ROCnROLL: | 1 | |
| TRIX (15,9): | -0.3076 | |
| Courbe Coppock: | 10.25 |
| MA7: | 0.253941 | |
| MA20: | 0.248169 | |
| MA50: | 0.268372 | |
| MA100: | 0.246700 | |
| MAexp7: | 0.258007 | |
| MAexp20: | 0.252607 | |
| MAexp50: | 0.256111 | |
| MAexp100: | 0.257145 | |
| Price / MA7: | +11.03% | |
| Price / MA20: | +13.61% | |
| Price / MA50: | +5.06% | |
| Price / MA100: | +14.29% | |
| Price / MAexp7: | +9.28% | |
| Price / MAexp20: | +11.62% | |
| Price / MAexp50: | +10.09% | |
| Price / MAexp100: | +9.65% |
About author
Online


Add a comment
Comments
0 comments on the analysis BASIC ATTENTION TOKEN - BAT/USD - Daily