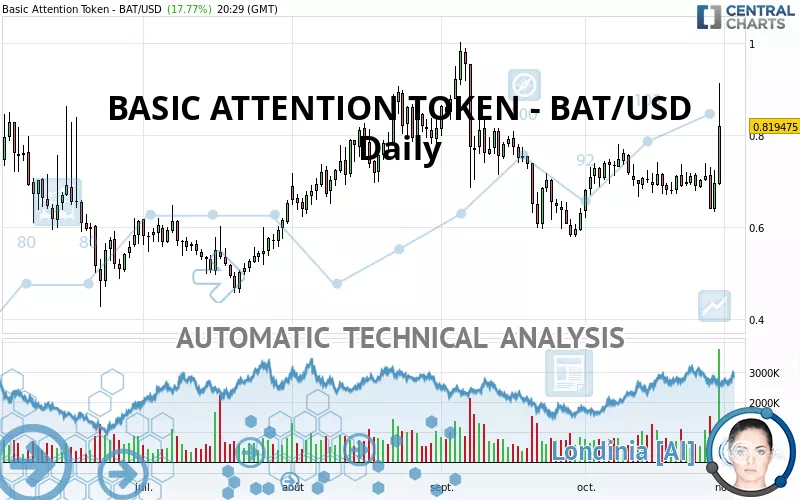
BASIC ATTENTION TOKEN - BAT/USD - Daily - Technical analysis published on 10/29/2021 (GMT)
- 273
- 0
Click here for a new analysis!
- Timeframe : Daily
- - Analysis generated on
- Status : TARGET REACHED
Summary of the analysis

Additional analysis
Quotes
BASIC ATTENTION TOKEN - BAT/USD rating 0.819475 USD. The price registered an increase of +17.77% on the session with the lowest point at 0.691445 USD and the highest point at 0.912955 USD. The deviation from the price is +18.52% for the low point and -10.24% for the high point.A bearish opening was detected by the Central Gaps scanner. Sellers are trying to impose a bearish trend in the very short term.
Bearish opening
Type : Bearish
Timeframe : Openning
Here is a more detailed summary of the historical variations registered by BASIC ATTENTION TOKEN - BAT/USD:
Abnormal volumes
Timeframe : 5 days
Technical
A technical analysis in Daily of this BASIC ATTENTION TOKEN - BAT/USD chart shows a bullish trend. The signals returned by the moving averages are 71.43% bullish. This bullish trend is reinforced by the strong signals currently being given by short-term moving averages. There is no crossing of moving average by the price or crossing of moving averages between themselves.
An assessment of technical indicators shows a moderate bullish signal.
Caution: the Central Indicators scanner currently detects an excess:
Previous candle closed under Bollinger bands
Type : Neutral
Timeframe : Daily
Pivot points : price is over resistance 3
Type : Neutral
Timeframe : Daily
Pivot points : price is over resistance 3
Type : Neutral
Timeframe : Weekly
Williams %R indicator is back over -50
Type : Bullish
Timeframe : Daily
The Central Patterns scanner, which studies chart patterns, resistances and supports, has identified these signals:
Near resistance of triangle
Type : Bearish
Timeframe : Daily
Horizontal resistance is broken
Type : Bullish
Timeframe : Daily
Resistance of channel is broken
Type : Bullish
Timeframe : Daily
Central Candlesticks, the scanner specialised in Japanese candlesticks, detects a bullish signal that could support the hypothesis of a small rebound in the very short term:
Bullish harami
Type : Bullish
Timeframe : Daily
| S3 | S2 | S1 | Price | R1 | R2 | R3 | |
|---|---|---|---|---|---|---|---|
| ProTrendLines | 0.466533 | 0.562021 | 0.760346 | 0.819475 | 0.983302 | 1.166530 | 1.422830 |
| Change (%) | -43.07% | -31.42% | -7.22% | - | +19.99% | +42.35% | +73.63% |
| Change | -0.352942 | -0.257454 | -0.059129 | - | +0.163827 | +0.347055 | +0.603355 |
| Level | Intermediate | Intermediate | Intermediate | - | Intermediate | Minor | Intermediate |
To determine price objectives, it is also possible to use the pivot points. Here is the price position in relation to pivot points:
| Pivot points | S3 | S2 | S1 | PP | R1 | R2 | R3 |
|---|---|---|---|---|---|---|---|
| Standard | 0.553851 | 0.593353 | 0.644598 | 0.684100 | 0.735345 | 0.774847 | 0.826092 |
| Camarilla | 0.670889 | 0.679207 | 0.687526 | 0.695844 | 0.704163 | 0.712481 | 0.720799 |
| Woodie | 0.559724 | 0.596289 | 0.650471 | 0.687036 | 0.741218 | 0.777783 | 0.831965 |
| Fibonacci | 0.593353 | 0.628018 | 0.649434 | 0.684100 | 0.718765 | 0.740181 | 0.774847 |
| Pivot points | S3 | S2 | S1 | PP | R1 | R2 | R3 |
|---|---|---|---|---|---|---|---|
| Standard | 0.606761 | 0.637918 | 0.674997 | 0.706154 | 0.743233 | 0.774390 | 0.811469 |
| Camarilla | 0.693311 | 0.699566 | 0.705821 | 0.712076 | 0.718331 | 0.724586 | 0.730841 |
| Woodie | 0.609722 | 0.639399 | 0.677958 | 0.707635 | 0.746194 | 0.775871 | 0.814430 |
| Fibonacci | 0.637918 | 0.663984 | 0.680088 | 0.706154 | 0.732220 | 0.748324 | 0.774390 |
| Pivot points | S3 | S2 | S1 | PP | R1 | R2 | R3 |
|---|---|---|---|---|---|---|---|
| Standard | 0.264536 | 0.421390 | 0.526451 | 0.683305 | 0.788366 | 0.945220 | 1.050281 |
| Camarilla | 0.559486 | 0.583495 | 0.607504 | 0.631513 | 0.655522 | 0.679531 | 0.703540 |
| Woodie | 0.238641 | 0.408442 | 0.500556 | 0.670357 | 0.762471 | 0.932272 | 1.024386 |
| Fibonacci | 0.421390 | 0.521441 | 0.583253 | 0.683305 | 0.783356 | 0.845168 | 0.945220 |
Numerical data
The following is the status of technical indicators and moving averages registered at the time this technical analysis was created:
| RSI (14): | 64.13 | |
| MACD (12,26,9): | 0.0048 | |
| Directional Movement: | 19.177094 | |
| AROON (14): | 7.142860 | |
| DEMA (21): | 0.710863 | |
| Parabolic SAR (0,02-0,02-0,2): | 0.632854 | |
| Elder Ray (13): | 0.090017 | |
| Super Trend (3,10): | 0.605411 | |
| Zig ZAG (10): | 0.829361 | |
| VORTEX (21): | 0.9598 | |
| Stochastique (14,3,5): | 42.79 | |
| TEMA (21): | 0.722999 | |
| Williams %R (14): | -30.50 | |
| Chande Momentum Oscillator (20): | 0.137032 | |
| Repulse (5,40,3): | 12.6591 | |
| ROCnROLL: | 1 | |
| TRIX (15,9): | -0.0567 | |
| Courbe Coppock: | 3.25 |
| MA7: | 0.710343 | |
| MA20: | 0.703085 | |
| MA50: | 0.705723 | |
| MA100: | 0.723013 | |
| MAexp7: | 0.722489 | |
| MAexp20: | 0.708652 | |
| MAexp50: | 0.713113 | |
| MAexp100: | 0.723009 | |
| Price / MA7: | +15.36% | |
| Price / MA20: | +16.55% | |
| Price / MA50: | +16.12% | |
| Price / MA100: | +13.34% | |
| Price / MAexp7: | +13.42% | |
| Price / MAexp20: | +15.64% | |
| Price / MAexp50: | +14.92% | |
| Price / MAexp100: | +13.34% |
About author

Online


Add a comment
Comments
0 comments on the analysis BASIC ATTENTION TOKEN - BAT/USD - Daily