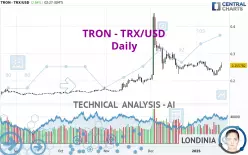
TRON - TRX/USD - Daily - Technical analysis published on 01/18/2025 (GMT)
- 587
- 0
Click here for a new analysis!
- Timeframe : Daily
- - Analysis generated on
- Status : INVALID

Summary of the analysis

Additional analysis
Quotes
The TRON - TRX/USD rating is 0.255782 USD. The price registered an increase of +2.84% on the session and was between 0.247108 USD and 0.267237 USD. This implies that the price is at +3.51% from its lowest and at -4.29% from its highest.A bearish opening was detected by the Central Gaps scanner. Sellers are trying to impose a bearish trend in the very short term.
Bearish opening
Type : Bearish
Timeframe : Openning
Here is a more detailed summary of the historical variations registered by TRON - TRX/USD:
Technical
Technical analysis of this Daily chart of TRON - TRX/USD indicates that the overall trend is bullish. 78.57% of the signals given by moving averages are bullish. This bullish trend shows slight signs of slowing down given the slightly bullish signals given by the short-term moving averages. The Central Indicators scanner detects bullish signals on moving averages that could impact this trend:
Bullish trend reversal : adaptative moving average 20
Type : Bullish
Timeframe : Daily
Bullish trend reversal : adaptative moving average 50
Type : Bullish
Timeframe : Daily
In fact, only 9 technical indicators out of 18 studied are currently bullish. The Central Indicators scanner found this result concerning these indicators:
RSI indicator is back under 50
Type : Bearish
Timeframe : Daily
No signals are given by Central Patterns, a market scanner specialised in chart patterns, resistances and supports.
For a small setback in the very short term, the Central Candlesticks scanner currently notes the presence of this bearish pattern in Japanese candlesticks:
Bearish harami
Type : Bearish
Timeframe : Daily
Bearish harami cross
Type : Bearish
Timeframe : Daily
| S3 | S2 | S1 | Price | R1 | R2 | R3 | |
|---|---|---|---|---|---|---|---|
| ProTrendLines | 0.109436 | 0.166341 | 0.194457 | 0.255782 | 0.270008 | 0.296663 | 0.435023 |
| Change (%) | -57.22% | -34.97% | -23.98% | - | +5.56% | +15.98% | +70.08% |
| Change | -0.146346 | -0.089441 | -0.061325 | - | +0.014226 | +0.040881 | +0.179241 |
| Level | Major | Major | Minor | - | Intermediate | Minor | Major |
To determine price objectives, it is also possible to use the pivot points. Here is the price position in relation to pivot points:
| Pivot points | S3 | S2 | S1 | PP | R1 | R2 | R3 |
|---|---|---|---|---|---|---|---|
| Standard | 0.226952 | 0.231983 | 0.240351 | 0.245382 | 0.253750 | 0.258781 | 0.267149 |
| Camarilla | 0.245035 | 0.246264 | 0.247492 | 0.248720 | 0.249948 | 0.251177 | 0.252405 |
| Woodie | 0.228622 | 0.232817 | 0.242021 | 0.246216 | 0.255420 | 0.259615 | 0.268819 |
| Fibonacci | 0.231983 | 0.237101 | 0.240263 | 0.245382 | 0.250500 | 0.253662 | 0.258781 |
| Pivot points | S3 | S2 | S1 | PP | R1 | R2 | R3 |
|---|---|---|---|---|---|---|---|
| Standard | 0.190719 | 0.213512 | 0.226860 | 0.249653 | 0.263001 | 0.285794 | 0.299142 |
| Camarilla | 0.230269 | 0.233582 | 0.236895 | 0.240208 | 0.243521 | 0.246834 | 0.250147 |
| Woodie | 0.185997 | 0.211151 | 0.222138 | 0.247292 | 0.258279 | 0.283433 | 0.294420 |
| Fibonacci | 0.213512 | 0.227318 | 0.235847 | 0.249653 | 0.263459 | 0.271988 | 0.285794 |
| Pivot points | S3 | S2 | S1 | PP | R1 | R2 | R3 |
|---|---|---|---|---|---|---|---|
| Standard | -0.092442 | 0.054810 | 0.154686 | 0.301938 | 0.401814 | 0.549066 | 0.648942 |
| Camarilla | 0.186601 | 0.209254 | 0.231908 | 0.254561 | 0.277214 | 0.299868 | 0.322521 |
| Woodie | -0.116131 | 0.042966 | 0.130997 | 0.290094 | 0.378125 | 0.537222 | 0.625253 |
| Fibonacci | 0.054810 | 0.149213 | 0.207535 | 0.301938 | 0.396341 | 0.454663 | 0.549066 |
Numerical data
The following is the status of technical indicators and moving averages registered at the time this technical analysis was created:
| RSI (14): | 49.93 | |
| MACD (12,26,9): | -0.0051 | |
| Directional Movement: | -1.181112 | |
| AROON (14): | -64.285714 | |
| DEMA (21): | 0.239852 | |
| Parabolic SAR (0,02-0,02-0,2): | 0.272309 | |
| Elder Ray (13): | 0.005511 | |
| Super Trend (3,10): | 0.262112 | |
| Zig ZAG (10): | 0.247909 | |
| VORTEX (21): | 0.9640 | |
| Stochastique (14,3,5): | 49.83 | |
| TEMA (21): | 0.233973 | |
| Williams %R (14): | -42.61 | |
| Chande Momentum Oscillator (20): | -0.020257 | |
| Repulse (5,40,3): | 4.3867 | |
| ROCnROLL: | 1 | |
| TRIX (15,9): | -0.3270 | |
| Courbe Coppock: | 17.90 |
| MA7: | 0.235732 | |
| MA20: | 0.248744 | |
| MA50: | 0.264974 | |
| MA100: | 0.219952 | |
| MAexp7: | 0.241500 | |
| MAexp20: | 0.246279 | |
| MAexp50: | 0.245157 | |
| MAexp100: | 0.225584 | |
| Price / MA7: | +8.51% | |
| Price / MA20: | +2.83% | |
| Price / MA50: | -3.47% | |
| Price / MA100: | +16.29% | |
| Price / MAexp7: | +5.91% | |
| Price / MAexp20: | +3.86% | |
| Price / MAexp50: | +4.33% | |
| Price / MAexp100: | +13.39% |
About author

Online


Add a comment
Comments
0 comments on the analysis TRON - TRX/USD - Daily