| Open: | 6.01 |
| Change: | -0.07 |
| Volume: | 9,959,765 |
| Low: | 5.91 |
| High: | 6.11 |
| High / Low range: | 0.20 |
| Type: | Cryptocurrencies |
| Ticker: | BTCUSDT |
| ISIN: |
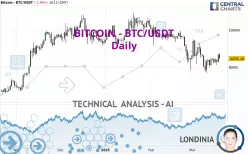
BITCOIN - BTC/USDT - Daily - Technical analysis published on 03/20/2025 (GMT)
- 257
- 0
- 03/20/2025 - 16:11
- Timeframe : Daily
- - Analysis generated on 03/20/2025 - 16:11
- Status : IN PROGRESS...

Summary of the analysis

Additional analysis
Quotes
The BITCOIN - BTC/USDT price is 84,595.48 USDT. The price registered a decrease of -2.46% on the session and was traded between 84,595.48 USDT and 87,407.38 USDT over the period. The price is currently at 0% from its lowest and -3.22% from its highest.A bullish opening was detected by the Central Gaps scanner. Buyers are trying to impose a bullish momentum in the very short term.
Bullish opening
Type : Bullish
Timeframe : Openning
Here is a more detailed summary of the historical variations registered by BITCOIN - BTC/USDT:
Technical
A technical analysis in Daily of this BITCOIN - BTC/USDT chart shows a sharp bearish trend. 89.29% of the signals given by moving averages are bearish. The slightly bearish signals from short-term moving averages show that the overall trend is slowing down. The Central Indicators scanner detects bullish and bearish signals on moving averages that could impact this trend:
Bullish trend reversal : Moving Average 20
Type : Bullish
Timeframe : Daily
Bearish price crossover with Moving Average 20
Type : Bearish
Timeframe : Daily
The technical indicators are generally neutral. They do not provide relevant information on the direction of future price movements.
Central Indicators, the scanner specialised in technical indicators, has identified these signals:
Parabolic SAR indicator bullish reversal
Type : Bullish
Timeframe : Daily
Price is back under the pivot point (Daily)
Type : Bearish
Timeframe : Daily
An analysis of the price chart with the Central Patterns scanner (detector of chart patterns and resistances and supports) shows a result that can have an impact on the price change:
Near resistance of triangle
Type : Bearish
Timeframe : Daily
The Central Candlesticks scanner which studies Japanese candlesticks did not detect anything.
| S3 | S2 | S1 | Price | R1 | R2 | R3 | |
|---|---|---|---|---|---|---|---|
| ProTrendLines | 73,074.27 | 78,735.39 | 84,087.23 | 84,595.48 | 92,437.77 | 99,103.45 | 106,173.51 |
| Change (%) | -13.62% | -6.93% | -0.60% | - | +9.27% | +17.15% | +25.51% |
| Change | -11,521.21 | -5,860.09 | -508.25 | - | +7,842.29 | +14,507.97 | +21,578.03 |
| Level | Major | Major | Minor | - | Intermediate | Minor | Major |
Attention could also be paid to pivot points to set price objectives:
| Pivot points | S3 | S2 | S1 | PP | R1 | R2 | R3 |
|---|---|---|---|---|---|---|---|
| Standard | 79,533.35 | 81,075.51 | 83,903.33 | 85,445.49 | 88,273.31 | 89,815.47 | 92,643.29 |
| Camarilla | 85,529.40 | 85,929.98 | 86,330.56 | 86,731.14 | 87,131.72 | 87,532.30 | 87,932.89 |
| Woodie | 80,176.17 | 81,396.93 | 84,546.15 | 85,766.91 | 88,916.13 | 90,136.89 | 93,286.11 |
| Fibonacci | 81,075.51 | 82,744.85 | 83,776.16 | 85,445.49 | 87,114.83 | 88,146.14 | 89,815.47 |
| Pivot points | S3 | S2 | S1 | PP | R1 | R2 | R3 |
|---|---|---|---|---|---|---|---|
| Standard | 69,057.81 | 72,952.51 | 78,662.31 | 82,557.01 | 88,266.81 | 92,161.51 | 97,871.31 |
| Camarilla | 81,730.87 | 82,611.29 | 83,491.70 | 84,372.11 | 85,252.52 | 86,132.94 | 87,013.35 |
| Woodie | 69,965.36 | 73,406.29 | 79,569.86 | 83,010.79 | 89,174.36 | 92,615.29 | 98,778.86 |
| Fibonacci | 72,952.51 | 76,621.43 | 78,888.09 | 82,557.01 | 86,225.93 | 88,492.59 | 92,161.51 |
| Pivot points | S3 | S2 | S1 | PP | R1 | R2 | R3 |
|---|---|---|---|---|---|---|---|
| Standard | 49,883.95 | 64,123.13 | 74,281.39 | 88,520.57 | 98,678.83 | 112,918.01 | 123,076.27 |
| Camarilla | 77,730.36 | 79,966.80 | 82,203.23 | 84,439.66 | 86,676.09 | 88,912.52 | 91,148.96 |
| Woodie | 47,843.50 | 63,102.90 | 72,240.94 | 87,500.34 | 96,638.38 | 111,897.78 | 121,035.82 |
| Fibonacci | 64,123.13 | 73,442.95 | 79,200.75 | 88,520.57 | 97,840.39 | 103,598.19 | 112,918.01 |
Numerical data
The following is the status of technical indicators and moving averages registered at the time this technical analysis was created:
| RSI (14): | 46.61 | |
| MACD (12,26,9): | -2,096.2800 | |
| Directional Movement: | -8.80 | |
| AROON (14): | -35.71 | |
| DEMA (21): | 82,436.68 | |
| Parabolic SAR (0,02-0,02-0,2): | 76,847.21 | |
| Elder Ray (13): | 1,466.30 | |
| Super Trend (3,10): | 76,695.94 | |
| Zig ZAG (10): | 84,688.40 | |
| VORTEX (21): | 1.0200 | |
| Stochastique (14,3,5): | 51.63 | |
| TEMA (21): | 82,797.34 | |
| Williams %R (14): | -44.58 | |
| Chande Momentum Oscillator (20): | -1,371.92 | |
| Repulse (5,40,3): | 0.4800 | |
| ROCnROLL: | -1 | |
| TRIX (15,9): | -0.4600 | |
| Courbe Coppock: | 7.52 |
| MA7: | 84,193.71 | |
| MA20: | 85,178.89 | |
| MA50: | 91,570.93 | |
| MA100: | 95,393.85 | |
| MAexp7: | 84,353.59 | |
| MAexp20: | 85,589.64 | |
| MAexp50: | 89,689.26 | |
| MAexp100: | 90,623.18 | |
| Price / MA7: | +0.48% | |
| Price / MA20: | -0.68% | |
| Price / MA50: | -7.62% | |
| Price / MA100: | -11.32% | |
| Price / MAexp7: | +0.29% | |
| Price / MAexp20: | -1.16% | |
| Price / MAexp50: | -5.68% | |
| Price / MAexp100: | -6.65% |
About author

Online


Add a comment
Comments
0 comments on the analysis BITCOIN - BTC/USDT - Daily