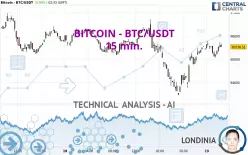
BITCOIN - BTC/USDT - 15 min. - Technical analysis published on 02/19/2025 (GMT)
- 142
- 0
Click here for a new analysis!
- Timeframe : 15 min.
- - Analysis generated on
- Status : LEVEL MAINTAINED

Summary of the analysis

Additional analysis
Quotes
The BITCOIN - BTC/USDT rating is 95,536.50 USDT. On the day, this instrument gained +0.00% and was between 95,059.94 USDT and 95,772.82 USDT. This implies that the price is at +0.50% from its lowest and at -0.25% from its highest.The Central Gaps scanner detects a bullish opening. A small advantage for buyers in the very short term.
Bullish opening
Type : Bullish
Timeframe : Openning
Here is a more detailed summary of the historical variations registered by BITCOIN - BTC/USDT:
Near a new LOW record (1 month)
Type : Bearish
Timeframe : Weekly
Technical
Technical analysis of BITCOIN - BTC/USDT in 15 min. shows an overall slightly bullish trend. 60.71% of the signals given by moving averages are bullish. This slightly bullish trend could be reinforced by the strong bullish signals given by short-term moving averages. The Central Indicators market scanner is currently detecting several bullish signals that could impact this trend:
Bullish trend reversal : adaptative moving average 100
Type : Bullish
Timeframe : 15 minutes
Bullish price crossover with adaptative moving average 100
Type : Bullish
Timeframe : 15 minutes
An assessment of technical indicators shows a slightly bullish signal.
Central Indicators, the detector scanner for these technical indicators has recently detected several signals:
Ichimoku : price is over the cloud
Type : Bullish
Timeframe : 15 minutes
Price is back under the pivot point
Type : Bearish
Timeframe : Weekly
Momentum indicator is back under 0
Type : Bearish
Timeframe : 15 minutes
Williams %R indicator is back under -50
Type : Bearish
Timeframe : 15 minutes
Williams %R indicator is back over -50
Type : Bullish
Timeframe : 15 minutes
An analysis of the price chart with the Central Patterns scanner (detector of chart patterns and resistances and supports) shows a result that can have an impact on the price change:
Near horizontal support
Type : Bullish
Timeframe : 15 minutes
No result was found by the Central Candlesticks scanner on Japanese candlesticks.
| S3 | S2 | S1 | Price | R1 | R2 | R3 | |
|---|---|---|---|---|---|---|---|
| ProTrendLines | 93,461.01 | 94,163.88 | 95,296.95 | 95,536.50 | 96,708.66 | 98,087.27 | 99,103.45 |
| Change (%) | -2.17% | -1.44% | -0.25% | - | +1.23% | +2.67% | +3.73% |
| Change | -2,075.49 | -1,372.62 | -239.55 | - | +1,172.16 | +2,550.77 | +3,566.95 |
| Level | Minor | Intermediate | Minor | - | Intermediate | Minor | Intermediate |
To determine price objectives, it is also possible to use the pivot points. Here is the price position in relation to pivot points:
| Pivot points | S3 | S2 | S1 | PP | R1 | R2 | R3 |
|---|---|---|---|---|---|---|---|
| Standard | 90,511.46 | 91,986.24 | 93,760.47 | 95,235.25 | 97,009.48 | 98,484.26 | 100,258.49 |
| Camarilla | 94,641.23 | 94,939.06 | 95,236.88 | 95,534.71 | 95,832.54 | 96,130.36 | 96,428.19 |
| Woodie | 90,661.20 | 92,061.10 | 93,910.21 | 95,310.11 | 97,159.22 | 98,559.12 | 100,408.23 |
| Fibonacci | 91,986.24 | 93,227.36 | 93,994.13 | 95,235.25 | 96,476.37 | 97,243.14 | 98,484.26 |
| Pivot points | S3 | S2 | S1 | PP | R1 | R2 | R3 |
|---|---|---|---|---|---|---|---|
| Standard | 90,250.69 | 92,207.28 | 94,884.97 | 96,841.56 | 99,519.25 | 101,475.84 | 104,153.53 |
| Camarilla | 96,288.22 | 96,713.03 | 97,137.84 | 97,562.65 | 97,987.46 | 98,412.27 | 98,837.08 |
| Woodie | 90,611.23 | 92,387.56 | 95,245.51 | 97,021.84 | 99,879.79 | 101,656.12 | 104,514.07 |
| Fibonacci | 92,207.28 | 93,977.58 | 95,071.27 | 96,841.56 | 98,611.86 | 99,705.55 | 101,475.84 |
| Pivot points | S3 | S2 | S1 | PP | R1 | R2 | R3 |
|---|---|---|---|---|---|---|---|
| Standard | 71,735.79 | 80,548.89 | 91,471.23 | 100,284.33 | 111,206.67 | 120,019.77 | 130,942.11 |
| Camarilla | 96,966.31 | 98,775.40 | 100,584.48 | 102,393.56 | 104,202.64 | 106,011.72 | 107,820.81 |
| Woodie | 72,790.40 | 81,076.20 | 92,525.84 | 100,811.64 | 112,261.28 | 120,547.08 | 131,996.72 |
| Fibonacci | 80,548.89 | 88,087.83 | 92,745.40 | 100,284.33 | 107,823.27 | 112,480.84 | 120,019.77 |
Numerical data
The following are the details of the technical indicators and moving averages that were collected to generate this technical analysis:
| RSI (14): | 57.43 | |
| MACD (12,26,9): | 143.5000 | |
| Directional Movement: | 9.01 | |
| AROON (14): | -35.71 | |
| DEMA (21): | 95,425.14 | |
| Parabolic SAR (0,02-0,02-0,2): | 95,627.06 | |
| Elder Ray (13): | 139.92 | |
| Super Trend (3,10): | 94,927.14 | |
| Zig ZAG (10): | 95,627.16 | |
| VORTEX (21): | 1.2300 | |
| Stochastique (14,3,5): | 67.01 | |
| TEMA (21): | 95,626.84 | |
| Williams %R (14): | -26.13 | |
| Chande Momentum Oscillator (20): | 54.71 | |
| Repulse (5,40,3): | 0.1400 | |
| ROCnROLL: | 1 | |
| TRIX (15,9): | 0.0300 | |
| Courbe Coppock: | 0.38 |
| MA7: | 96,387.16 | |
| MA20: | 97,400.74 | |
| MA50: | 98,919.79 | |
| MA100: | 97,700.50 | |
| MAexp7: | 95,447.44 | |
| MAexp20: | 95,233.88 | |
| MAexp50: | 95,167.17 | |
| MAexp100: | 95,355.87 | |
| Price / MA7: | -0.88% | |
| Price / MA20: | -1.91% | |
| Price / MA50: | -3.42% | |
| Price / MA100: | -2.21% | |
| Price / MAexp7: | +0.09% | |
| Price / MAexp20: | +0.32% | |
| Price / MAexp50: | +0.39% | |
| Price / MAexp100: | +0.19% |
About author

Online


Add a comment
Comments
0 comments on the analysis BITCOIN - BTC/USDT - 15 min.