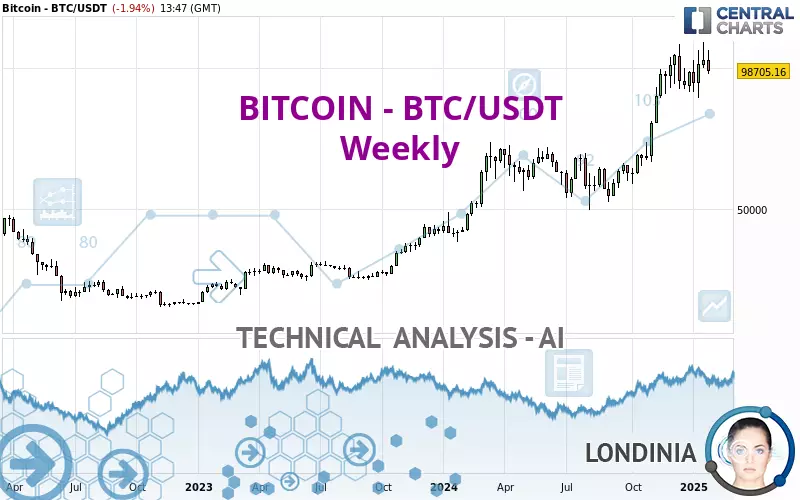
BITCOIN - BTC/USDT - Weekly - Technical analysis published on 02/02/2025 (GMT)
- 136
- 0
- Timeframe : Weekly
- - Analysis generated on
- Status : IN PROGRESS...

Summary of the analysis

Additional analysis
Quotes
The BITCOIN - BTC/USDT rating is 98,705.16 USDT. Over 5 days, this instrument lost -3.29% and was traded between 98,237.59 USDT and 106,293.11 USDT over the period. The price is currently at +0.48% from its lowest point and -7.14% from its highest point.The Central Gaps scanner detects a bearish opening. A small advantage for sellers in the very short term.
Bullish opening
Type : Bullish
Timeframe : Openning
Bearish opening
Type : Bearish
Timeframe : Openning
A study of price movements over other periods shows the following variations:
Near a new HIGH record (1 year)
Type : Bullish
Timeframe : Weekly
Near a new HIGH record (1st january)
Type : Bullish
Timeframe : Weekly
Near a new HIGH record (1 month)
Type : Bullish
Timeframe : Weekly
Technical
Technical analysis of BITCOIN - BTC/USDT in Weekly shows a strongly overall bullish trend. The signals given by the moving averages are 92.86% bullish. This strong bullish trend is confirmed by the strong signals currently being given by short-term moving averages. The Central Indicators scanner does not detect any result on moving averages that would impact this trend.
The probability of a further increase is high given the direction of the technical indicators.
But beware of excesses. The Central Indicators scanner currently detects this:
MACD indicator: bearish divergence
Type : Bullish
Timeframe : Weekly
RSI indicator: bearish divergence
Type : Bearish
Timeframe : Weekly
Price is back under the pivot point
Type : Bearish
Timeframe : Weekly
The analysis of the price chart with Central Patterns scanners does not return any result.
The presence of a bearish pattern in Japanese candlesticks detected by Central Candlesticks that could cause a correction in the very short term was also detected:
Bearish harami
Type : Bearish
Timeframe : Weekly
| S3 | S2 | S1 | Price | R1 | |
|---|---|---|---|---|---|
| ProTrendLines | 39,567.66 | 53,970.16 | 73,074.27 | 98,705.16 | 106,097.60 |
| Change (%) | -59.91% | -45.32% | -25.97% | - | +7.49% |
| Change | -59,137.50 | -44,735.00 | -25,630.89 | - | +7,392.44 |
| Level | Minor | Major | Major | - | Major |
To determine price objectives, it is also possible to use the pivot points. Here is the price position in relation to pivot points:
| Pivot points | S3 | S2 | S1 | PP | R1 | R2 | R3 |
|---|---|---|---|---|---|---|---|
| Standard | 97,195.32 | 98,728.59 | 99,693.20 | 101,226.47 | 102,191.08 | 103,724.35 | 104,688.96 |
| Camarilla | 99,970.89 | 100,199.87 | 100,428.84 | 100,657.81 | 100,886.78 | 101,115.76 | 101,344.73 |
| Woodie | 96,910.99 | 98,586.43 | 99,408.87 | 101,084.31 | 101,906.75 | 103,582.19 | 104,404.63 |
| Fibonacci | 98,728.59 | 99,682.78 | 100,272.28 | 101,226.47 | 102,180.66 | 102,770.16 | 103,724.35 |
| Pivot points | S3 | S2 | S1 | PP | R1 | R2 | R3 |
|---|---|---|---|---|---|---|---|
| Standard | 88,592.23 | 93,259.46 | 96,958.64 | 101,625.87 | 105,325.05 | 109,992.28 | 113,691.46 |
| Camarilla | 98,357.05 | 99,123.97 | 99,890.89 | 100,657.81 | 101,424.73 | 102,191.65 | 102,958.57 |
| Woodie | 88,108.20 | 93,017.45 | 96,474.61 | 101,383.86 | 104,841.02 | 109,750.27 | 113,207.43 |
| Fibonacci | 93,259.46 | 96,455.43 | 98,429.91 | 101,625.87 | 104,821.84 | 106,796.32 | 109,992.28 |
| Pivot points | S3 | S2 | S1 | PP | R1 | R2 | R3 |
|---|---|---|---|---|---|---|---|
| Standard | 71,735.79 | 80,548.89 | 91,471.23 | 100,284.33 | 111,206.67 | 120,019.77 | 130,942.11 |
| Camarilla | 96,966.31 | 98,775.40 | 100,584.48 | 102,393.56 | 104,202.64 | 106,011.72 | 107,820.81 |
| Woodie | 72,790.40 | 81,076.20 | 92,525.84 | 100,811.64 | 112,261.28 | 120,547.08 | 131,996.72 |
| Fibonacci | 80,548.89 | 88,087.83 | 92,745.40 | 100,284.33 | 107,823.27 | 112,480.84 | 120,019.77 |
Numerical data
The following is the status of technical indicators and moving averages registered at the time this technical analysis was created:
| RSI (14): | 63.04 | |
| MACD (12,26,9): | 9,517.6300 | |
| Directional Movement: | 18.99 | |
| AROON (14): | 78.57 | |
| DEMA (21): | 101,835.10 | |
| Parabolic SAR (0,02-0,02-0,2): | 89,756.71 | |
| Elder Ray (13): | 5,363.24 | |
| Super Trend (3,10): | 74,796.14 | |
| Zig ZAG (10): | 98,242.35 | |
| VORTEX (21): | 1.2300 | |
| Stochastique (14,3,5): | 79.85 | |
| TEMA (21): | 104,955.20 | |
| Williams %R (14): | -25.67 | |
| Chande Momentum Oscillator (20): | 8,393.98 | |
| Repulse (5,40,3): | -4.5200 | |
| ROCnROLL: | 1 | |
| TRIX (15,9): | 1.8800 | |
| Courbe Coppock: | 81.76 |
| MA7: | 101,895.18 | |
| MA20: | 102,396.06 | |
| MA50: | 99,258.45 | |
| MA100: | 93,621.93 | |
| MAexp7: | 98,475.61 | |
| MAexp20: | 89,430.63 | |
| MAexp50: | 74,368.22 | |
| MAexp100: | 60,271.20 | |
| Price / MA7: | -3.13% | |
| Price / MA20: | -3.60% | |
| Price / MA50: | -0.56% | |
| Price / MA100: | +5.43% | |
| Price / MAexp7: | +0.23% | |
| Price / MAexp20: | +10.37% | |
| Price / MAexp50: | +32.72% | |
| Price / MAexp100: | +63.77% |
About author

Online


Add a comment
Comments
0 comments on the analysis BITCOIN - BTC/USDT - Weekly