BITCOIN - BTC/USDT - 1H - Technical analysis published on 11/06/2024 (GMT)
- 261
- 0
Click here for a new analysis!
- Timeframe : 1H
- - Analysis generated on
- Status : LEVEL MAINTAINED
Summary of the analysis

Additional analysis
Quotes
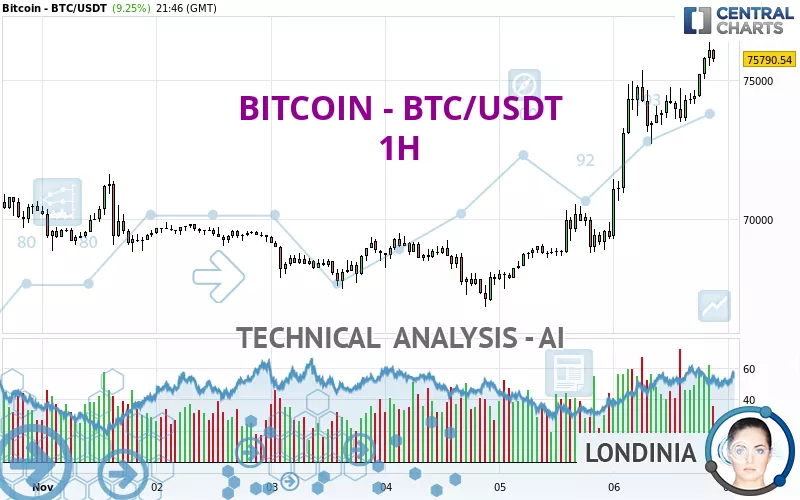
BITCOIN - BTC/USDT rating 75,789.85 USDT. The price has increased by +9.25% since the last closing with the lowest point at 69,297.18 USDT and the highest point at 76,387.05 USDT. The deviation from the price is +9.37% for the low point and -0.78% for the high point.A study of price movements over other periods shows the following variations:
New HIGH record (5 years)
Type : Bullish
Timeframe : Weekly
New HIGH record (1 year)
Type : Bullish
Timeframe : Weekly
New HIGH record (1st january)
Type : Bullish
Timeframe : Weekly
New HIGH record (1 month)
Type : Bullish
Timeframe : Weekly
Technical
A technical analysis in 1H of this BITCOIN - BTC/USDT chart shows a strongly bullish trend. 92.86% of the signals given by moving averages are bullish. The overall trend is supported by the strong bullish signals from short-term moving averages. There is no crossing of moving average by the price or crossing of moving averages between themselves.
Technical indicators are strongly bullish, suggesting that the price increase should continue.
Caution: the Central Indicators scanner currently detects an excess:
RSI indicator is overbought : over 70
Type : Neutral
Timeframe : 1 hour
CCI indicator is overbought : over 100
Type : Neutral
Timeframe : 1 hour
Previous candle closed over Bollinger bands
Type : Neutral
Timeframe : 1 hour
CCI indicator: bearish divergence
Type : Bearish
Timeframe : 1 hour
Williams %R indicator is overbought : over -20
Type : Neutral
Timeframe : 1 hour
Pivot points : price is over resistance 1
Type : Neutral
Timeframe : Weekly
Pivot points : price is over resistance 3
Type : Neutral
Timeframe : 1 hour
Central Patterns, the scanner specializing in chart patterns, did not identify any signals.
The Central Candlesticks scanner which studies Japanese candlesticks did not detect anything.
| S3 | S2 | S1 | Price | |
|---|---|---|---|---|
| ProTrendLines | 71,634.85 | 73,074.27 | 73,621.73 | 75,789.85 |
| Change (%) | -5.48% | -3.58% | -2.86% | - |
| Change | -4,155.00 | -2,715.58 | -2,168.12 | - |
| Level | Intermediate | Major | Intermediate | - |
Attention could also be paid to pivot points to set price objectives:
| Pivot points | S3 | S2 | S1 | PP | R1 | R2 | R3 |
|---|---|---|---|---|---|---|---|
| Standard | 64,642.27 | 66,057.45 | 67,716.52 | 69,131.70 | 70,790.77 | 72,205.95 | 73,865.02 |
| Camarilla | 68,530.17 | 68,811.98 | 69,093.78 | 69,375.59 | 69,657.40 | 69,939.20 | 70,221.01 |
| Woodie | 64,764.22 | 66,118.42 | 67,838.47 | 69,192.67 | 70,912.72 | 72,266.92 | 73,986.97 |
| Fibonacci | 66,057.45 | 67,231.81 | 67,957.34 | 69,131.70 | 70,306.06 | 71,031.59 | 72,205.95 |
| Pivot points | S3 | S2 | S1 | PP | R1 | R2 | R3 |
|---|---|---|---|---|---|---|---|
| Standard | 59,636.67 | 63,284.38 | 66,326.32 | 69,974.03 | 73,015.97 | 76,663.68 | 79,705.62 |
| Camarilla | 67,528.62 | 68,141.83 | 68,755.05 | 69,368.27 | 69,981.49 | 70,594.71 | 71,207.92 |
| Woodie | 59,333.80 | 63,132.94 | 66,023.45 | 69,822.59 | 72,713.10 | 76,512.24 | 79,402.75 |
| Fibonacci | 63,284.38 | 65,839.82 | 67,418.58 | 69,974.03 | 72,529.47 | 74,108.23 | 76,663.68 |
| Pivot points | S3 | S2 | S1 | PP | R1 | R2 | R3 |
|---|---|---|---|---|---|---|---|
| Standard | 46,967.17 | 52,962.74 | 61,630.58 | 67,626.15 | 76,293.99 | 82,289.56 | 90,957.40 |
| Camarilla | 66,265.97 | 67,610.12 | 68,954.26 | 70,298.41 | 71,642.56 | 72,986.70 | 74,330.85 |
| Woodie | 48,303.30 | 53,630.81 | 62,966.71 | 68,294.22 | 77,630.12 | 82,957.63 | 92,293.53 |
| Fibonacci | 52,962.74 | 58,564.17 | 62,024.73 | 67,626.15 | 73,227.58 | 76,688.14 | 82,289.56 |
Numerical data
The following are the details of the technical indicators and moving averages that were collected to generate this technical analysis:
| RSI (14): | 71.41 | |
| MACD (12,26,9): | 1,256.4700 | |
| Directional Movement: | 28.34 | |
| AROON (14): | 85.72 | |
| DEMA (21): | 75,697.20 | |
| Parabolic SAR (0,02-0,02-0,2): | 74,434.59 | |
| Elder Ray (13): | 1,232.41 | |
| Super Trend (3,10): | 73,499.81 | |
| Zig ZAG (10): | 75,724.19 | |
| VORTEX (21): | 1.3200 | |
| Stochastique (14,3,5): | 92.08 | |
| TEMA (21): | 76,011.36 | |
| Williams %R (14): | -15.23 | |
| Chande Momentum Oscillator (20): | 1,986.94 | |
| Repulse (5,40,3): | 0.7000 | |
| ROCnROLL: | 1 | |
| TRIX (15,9): | 0.2500 | |
| Courbe Coppock: | 4.26 |
| MA7: | 70,138.81 | |
| MA20: | 69,165.43 | |
| MA50: | 65,715.95 | |
| MA100: | 62,531.16 | |
| MAexp7: | 75,271.52 | |
| MAexp20: | 74,037.38 | |
| MAexp50: | 72,071.35 | |
| MAexp100: | 70,860.56 | |
| Price / MA7: | +8.06% | |
| Price / MA20: | +9.58% | |
| Price / MA50: | +15.33% | |
| Price / MA100: | +21.20% | |
| Price / MAexp7: | +0.69% | |
| Price / MAexp20: | +2.37% | |
| Price / MAexp50: | +5.16% | |
| Price / MAexp100: | +6.96% |
About author

Online


Add a comment
Comments
0 comments on the analysis BITCOIN - BTC/USDT - 1H