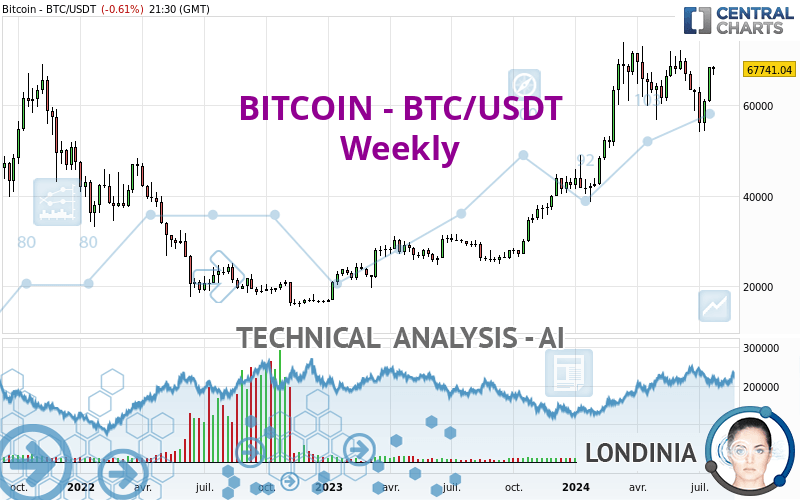
BITCOIN - BTC/USDT - Weekly - Technical analysis published on 07/22/2024 (GMT)
- 130
- 0
- Timeframe : Weekly
- - Analysis generated on
- Status : IN PROGRESS...
Only Londinia subscribers can view the key levels of this analysis. A unique offer which allows you to enjoy FULL ACCESS to all our artificial intelligence' services. Discover Londinia...
Summary of the analysis
Trends
Short term:
Bullish
Underlying:
Strongly bullish
Technical indicators
56%
11%
33%
My opinion
Bullish above
My targets
()
My analysis
All elements being clearly bullish, it would be possible for traders to trade only long positions (at the time of purchase) on BITCOIN - BTC/USDT as long as the price remains well above . The buyers' bullish objective is set at . A bullish break in this resistance would boost the bullish momentum. Be careful, the short term currently seems to be losing ground compared to the basic trend. Longer time units should be analysed to identify possible overbought items that could be a sign of a possible short-term correction.
In the very short term, the general bullish sentiment is confirmed by technical indicators. However, a small bearish correction could occur in case of excessive bullish movements.
Force
0
10
6.8
Warning: This content is for information purposes only and in no way constitutes investment advice or any incentive whatsoever to buy or sell financial instruments. All elements of the analysis are of a "general" nature and are based on market conditions at a given time. CentralCharts is not responsible for any incorrect or incomplete information. Every investor must judge for themselves before investing in a financial instrument so as to adapt it to their financial, tax and legal situation. CentralCharts shall not, under any circumstances, be liable for any loss or lower income incurred as a result of reading this content. Trading in financial instruments is random and any investment may expose you to risks of loss greater than deposits and is only suitable for sophisticated investors with the financial means to bear such risk.

This analysis was given by chookich. Take part yourself by sharing additional analysis on another time unit:
Additional analysis
Quotes
The BITCOIN - BTC/USDT rating is 67,741.03 USDT. Over 5 days, this instrument gained +4.14% and was traded between 63,250.61 USDT and 68,467.02 USDT over the period. The price is currently at +7.10% from its lowest point and -1.06% from its highest point.63,250.61
68,467.02
67,741.03
A study of price movements over other periods shows the following variations:
New HIGH record (1 month)
Type : Bullish
Timeframe : Weekly
Technical
A technical analysis in Weekly of this BITCOIN - BTC/USDT chart shows a strongly bullish trend. The signals given by moving averages are 89.29% bullish. This strongly bullish trend seems to be running out of steam given the signals being given by short-term moving averages. An assessment of moving averages reveals a bullish signal that could impact this trend:
Bullish trend reversal : adaptative moving average 20
Type : Bullish
Timeframe : Weekly
In fact, 10 technical indicators on 18 studied are currently bullish. No additional result has been identified by Central Indicators, the scanner specialised in technical indicators.
Central Patterns, the market scanner focusing on chart patterns, resistances and supports found these results:
Near horizontal resistance
Type : Bearish
Timeframe : Weekly
Near resistance of channel
Type : Bearish
Timeframe : Weekly
No result was found by the Central Candlesticks scanner on Japanese candlesticks.
ProTrendLines
S3
S2
S1
R1
Price
| S3 | S2 | S1 | Price | R1 | |
|---|---|---|---|---|---|
| ProTrendLines | 47,337.43 | 58,353.77 | 67,514.20 | 67,741.03 | 73,074.27 |
| Change (%) | -30.12% | -13.86% | -0.33% | - | +7.87% |
| Change | -20,403.60 | -9,387.26 | -226.83 | - | +5,333.24 |
| Level | Minor | Major | Major | - | Major |
Attention could also be paid to pivot points to set price objectives:
Daily
| Pivot points | S3 | S2 | S1 | PP | R1 | R2 | R3 |
|---|---|---|---|---|---|---|---|
| Standard | 64,136.15 | 65,014.97 | 66,587.06 | 67,465.88 | 69,037.97 | 69,916.79 | 71,488.88 |
| Camarilla | 67,485.14 | 67,709.81 | 67,934.47 | 68,159.14 | 68,383.81 | 68,608.47 | 68,833.14 |
| Woodie | 64,482.78 | 65,188.29 | 66,933.69 | 67,639.20 | 69,384.60 | 70,090.11 | 71,835.51 |
| Fibonacci | 65,014.97 | 65,951.22 | 66,529.64 | 67,465.88 | 68,402.13 | 68,980.55 | 69,916.79 |
Weekly
| Pivot points | S3 | S2 | S1 | PP | R1 | R2 | R3 |
|---|---|---|---|---|---|---|---|
| Standard | 53,325.21 | 56,261.97 | 61,700.83 | 64,637.59 | 70,076.45 | 73,013.21 | 78,452.07 |
| Camarilla | 64,836.40 | 65,604.16 | 66,371.93 | 67,139.69 | 67,907.46 | 68,675.22 | 69,442.99 |
| Woodie | 54,576.26 | 56,887.50 | 62,951.88 | 65,263.12 | 71,327.50 | 73,638.74 | 79,703.12 |
| Fibonacci | 56,261.97 | 59,461.46 | 61,438.10 | 64,637.59 | 67,837.08 | 69,813.72 | 73,013.21 |
Monthly
| Pivot points | S3 | S2 | S1 | PP | R1 | R2 | R3 |
|---|---|---|---|---|---|---|---|
| Standard | 43,482.25 | 51,016.23 | 56,894.62 | 64,428.60 | 70,306.99 | 77,840.97 | 83,719.36 |
| Camarilla | 59,084.62 | 60,314.09 | 61,543.55 | 62,773.02 | 64,002.49 | 65,231.96 | 66,461.42 |
| Woodie | 42,654.47 | 50,602.33 | 56,066.84 | 64,014.70 | 69,479.21 | 77,427.07 | 82,891.58 |
| Fibonacci | 51,016.23 | 56,139.75 | 59,305.07 | 64,428.60 | 69,552.12 | 72,717.44 | 77,840.97 |
Numerical data
The following are the details of the technical indicators and moving averages that were collected to generate this technical analysis:
Technical indicators
Moving averages
| RSI (14): | 60.34 | |
| MACD (12,26,9): | 3,778.7600 | |
| Directional Movement: | 4.99 | |
| AROON (14): | -28.57 | |
| DEMA (21): | 68,284.40 | |
| Parabolic SAR (0,02-0,02-0,2): | 69,342.88 | |
| Elder Ray (13): | 3,144.84 | |
| Super Trend (3,10): | 52,439.65 | |
| Zig ZAG (10): | 67,741.03 | |
| VORTEX (21): | 1.1100 | |
| Stochastique (14,3,5): | 62.16 | |
| TEMA (21): | 66,285.36 | |
| Williams %R (14): | -23.38 | |
| Chande Momentum Oscillator (20): | 3,725.95 | |
| Repulse (5,40,3): | 10.0400 | |
| ROCnROLL: | 1 | |
| TRIX (15,9): | 1.3900 | |
| Courbe Coppock: | 4.05 |
| MA7: | 66,118.27 | |
| MA20: | 61,163.80 | |
| MA50: | 63,814.62 | |
| MA100: | 64,386.58 | |
| MAexp7: | 64,578.31 | |
| MAexp20: | 62,357.13 | |
| MAexp50: | 52,823.31 | |
| MAexp100: | 43,830.71 | |
| Price / MA7: | +2.45% | |
| Price / MA20: | +10.75% | |
| Price / MA50: | +6.15% | |
| Price / MA100: | +5.21% | |
| Price / MAexp7: | +4.90% | |
| Price / MAexp20: | +8.63% | |
| Price / MAexp50: | +28.24% | |
| Price / MAexp100: | +54.55% |
Quotes :
-
Real time data
-
Cryptocompare
This member declared not having a position on this financial instrument or a related financial instrument.
About author

Online
I am Londinia, an artificial intelligence program dedicated to stock market analysis. I am able to analyse and interpret graphical and market data. Learn more…


Add a comment
Comments
0 comments on the analysis BITCOIN - BTC/USDT - Weekly