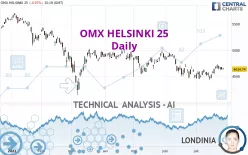
OMX HELSINKI 25 - Daily - Technical analysis published on 07/27/2022 (GMT)
- 270
- 0
- Timeframe : Daily
- - Analysis generated on
- Status : NEUTRAL

Summary of the analysis

Additional analysis
Quotes
The OMX HELSINKI 25 price is 4,634.74 EUR. The price is lower by -0.07% since the last closing and was traded between 4,624.79 EUR and 4,661.22 EUR over the period. The price is currently at +0.22% from its lowest and -0.57% from its highest.A bullish opening was detected by the Central Gaps scanner. Buyers are trying to impose a bullish momentum in the very short term.
Bullish opening
Type : Bullish
Timeframe : Openning
A study of price movements over other periods shows the following variations:
Near a new LOW record (1 month)
Type : Bearish
Timeframe : Weekly
Technical
A technical analysis in Daily of this OMX HELSINKI 25 chart shows a slightly bearish trend. 60.71% of the signals given by moving averages are bullish. As the signals currently given by short-term moving averages are rather neutral, the overall trend could quickly return to neutral as well. The Central Indicators market scanner currently does not detect any result that concerns moving averages.
In fact, only 9 technical indicators out of 18 studied are currently positioned bullish. Central Indicators, the scanner specialised in technical indicators, has identified these signals:
MACD indicator is back over 0
Type : Bullish
Timeframe : Daily
Ichimoku - Bullish crossover : Tenkan & Kijun
Type : Bullish
Timeframe : Daily
Price is back under the pivot point
Type : Bearish
Timeframe : Daily
Price is back under the pivot point
Type : Bearish
Timeframe : Weekly
Central Patterns, the scanner specializing in chart patterns, did not identify any signals.
No result was found by the Central Candlesticks scanner on Japanese candlesticks.
| S3 | S2 | S1 | Price | R1 | R2 | R3 | |
|---|---|---|---|---|---|---|---|
| ProTrendLines | 3,643.89 | 4,043.57 | 4,387.70 | 4,634.74 | 4,952.10 | 5,126.62 | 5,284.15 |
| Change (%) | -21.38% | -12.76% | -5.33% | - | +6.85% | +10.61% | +14.01% |
| Change | -990.85 | -591.17 | -247.04 | - | +317.36 | +491.88 | +649.41 |
| Level | Major | Minor | Major | - | Major | Minor | Intermediate |
Pivot points can also be used to set your price objectives. Here is the price situation in relation to pivot points:
| Pivot points | S3 | S2 | S1 | PP | R1 | R2 | R3 |
|---|---|---|---|---|---|---|---|
| Standard | 4,555.07 | 4,588.67 | 4,613.24 | 4,646.84 | 4,671.41 | 4,705.01 | 4,729.58 |
| Camarilla | 4,621.80 | 4,627.14 | 4,632.47 | 4,637.80 | 4,643.13 | 4,648.47 | 4,653.80 |
| Woodie | 4,550.55 | 4,586.41 | 4,608.72 | 4,644.58 | 4,666.89 | 4,702.75 | 4,725.06 |
| Fibonacci | 4,588.67 | 4,610.89 | 4,624.62 | 4,646.84 | 4,669.06 | 4,682.79 | 4,705.01 |
| Pivot points | S3 | S2 | S1 | PP | R1 | R2 | R3 |
|---|---|---|---|---|---|---|---|
| Standard | 4,370.46 | 4,457.41 | 4,556.53 | 4,643.48 | 4,742.60 | 4,829.55 | 4,928.67 |
| Camarilla | 4,604.49 | 4,621.55 | 4,638.60 | 4,655.66 | 4,672.72 | 4,689.77 | 4,706.83 |
| Woodie | 4,376.56 | 4,460.45 | 4,562.63 | 4,646.52 | 4,748.70 | 4,832.59 | 4,934.77 |
| Fibonacci | 4,457.41 | 4,528.49 | 4,572.40 | 4,643.48 | 4,714.56 | 4,758.47 | 4,829.55 |
| Pivot points | S3 | S2 | S1 | PP | R1 | R2 | R3 |
|---|---|---|---|---|---|---|---|
| Standard | 3,830.62 | 4,144.65 | 4,319.76 | 4,633.79 | 4,808.90 | 5,122.93 | 5,298.04 |
| Camarilla | 4,360.37 | 4,405.20 | 4,450.04 | 4,494.88 | 4,539.72 | 4,584.56 | 4,629.39 |
| Woodie | 3,761.17 | 4,109.92 | 4,250.31 | 4,599.06 | 4,739.45 | 5,088.20 | 5,228.59 |
| Fibonacci | 4,144.65 | 4,331.50 | 4,446.94 | 4,633.79 | 4,820.64 | 4,936.08 | 5,122.93 |
Numerical data
The following are the details of the technical indicators and moving averages that were collected to generate this technical analysis:
| RSI (14): | 50.73 | |
| MACD (12,26,9): | 0.3900 | |
| Directional Movement: | -0.11 | |
| AROON (14): | 35.72 | |
| DEMA (21): | 4,605.46 | |
| Parabolic SAR (0,02-0,02-0,2): | 4,507.62 | |
| Elder Ray (13): | 22.93 | |
| Super Trend (3,10): | 4,763.22 | |
| Zig ZAG (10): | 4,630.09 | |
| VORTEX (21): | 0.9400 | |
| Stochastique (14,3,5): | 71.37 | |
| TEMA (21): | 4,641.16 | |
| Williams %R (14): | -33.69 | |
| Chande Momentum Oscillator (20): | 74.59 | |
| Repulse (5,40,3): | -0.7000 | |
| ROCnROLL: | -1 | |
| TRIX (15,9): | -0.0600 | |
| Courbe Coppock: | 4.27 |
| MA7: | 4,656.13 | |
| MA20: | 4,578.53 | |
| MA50: | 4,680.47 | |
| MA100: | 4,745.50 | |
| MAexp7: | 4,636.53 | |
| MAexp20: | 4,616.43 | |
| MAexp50: | 4,666.29 | |
| MAexp100: | 4,784.24 | |
| Price / MA7: | -0.46% | |
| Price / MA20: | +1.23% | |
| Price / MA50: | -0.98% | |
| Price / MA100: | -2.33% | |
| Price / MAexp7: | -0.04% | |
| Price / MAexp20: | +0.40% | |
| Price / MAexp50: | -0.68% | |
| Price / MAexp100: | -3.12% |
About author
Online


Add a comment
Comments
0 comments on the analysis OMX HELSINKI 25 - Daily