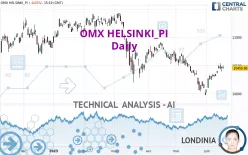
OMX HELSINKI_PI - Daily - Technical analysis published on 06/16/2023 (GMT)
- 165
- 0
Click here for a new analysis!
- Timeframe : Daily
- - Analysis generated on
- Status : TARGET REACHED

Summary of the analysis
Additional analysis
Quotes
The OMX HELSINKI_PI rating is 10,455.96 EUR. The price is lower by -0.02% since the last closing and was traded between 10,434.06 EUR and 10,496.27 EUR over the period. The price is currently at +0.21% from its lowest and -0.38% from its highest.A bullish opening was detected by the Central Gaps scanner. Buyers are trying to impose a bullish momentum in the very short term.
Bullish opening
Type : Bullish
Timeframe : Openning
Here is a more detailed summary of the historical variations registered by OMX HELSINKI_PI:
Near a new LOW record (1st january)
Type : Bearish
Timeframe : Weekly
Near a new LOW record (1 month)
Type : Bearish
Timeframe : Weekly
Technical
Technical analysis of this Daily chart of OMX HELSINKI_PI indicates that the overall trend is bearish. 71.43% of the signals given by moving averages are bearish. Caution: as the signals currently given by short-term moving averages are rather neutral, the bearish trend could slow down. The Central Indicators market scanner is currently detecting a bearish signal that could impact this trend:
Bearish trend reversal : adaptative moving average 50
Type : Bearish
Timeframe : Daily
In fact, 11 technical indicators on 18 studied are currently positioned bullish. Caution: the Central Indicators scanner currently detects an excess:
CCI indicator is overbought : over 100
Type : Neutral
Timeframe : Daily
Williams %R indicator is overbought : over -20
Type : Neutral
Timeframe : Daily
Pivot points : price is over resistance 2
Type : Neutral
Timeframe : Weekly
Price is back under the pivot point
Type : Bearish
Timeframe : Daily
Central Patterns, the scanner specializing in chart patterns, did not identify any signals.
The Central Candlesticks scanner, specialised in Japanese candlesticks, did not identify any signals.
| S3 | S2 | S1 | Price | R1 | R2 | R3 | |
|---|---|---|---|---|---|---|---|
| ProTrendLines | 9,756.93 | 9,972.88 | 10,353.00 | 10,455.96 | 10,567.60 | 10,736.90 | 11,085.50 |
| Change (%) | -6.69% | -4.62% | -0.98% | - | +1.07% | +2.69% | +6.02% |
| Change | -699.03 | -483.08 | -102.96 | - | +111.64 | +280.94 | +629.54 |
| Level | Minor | Minor | Major | - | Intermediate | Major | Minor |
Attention could also be paid to pivot points to set price objectives:
| Pivot points | S3 | S2 | S1 | PP | R1 | R2 | R3 |
|---|---|---|---|---|---|---|---|
| Standard | 10,306.77 | 10,347.19 | 10,402.48 | 10,442.90 | 10,498.19 | 10,538.61 | 10,593.90 |
| Camarilla | 10,431.44 | 10,440.21 | 10,448.99 | 10,457.76 | 10,466.53 | 10,475.31 | 10,484.08 |
| Woodie | 10,314.20 | 10,350.91 | 10,409.91 | 10,446.62 | 10,505.62 | 10,542.33 | 10,601.33 |
| Fibonacci | 10,347.19 | 10,383.76 | 10,406.34 | 10,442.90 | 10,479.47 | 10,502.05 | 10,538.61 |
| Pivot points | S3 | S2 | S1 | PP | R1 | R2 | R3 |
|---|---|---|---|---|---|---|---|
| Standard | 10,156.59 | 10,196.68 | 10,270.10 | 10,310.19 | 10,383.61 | 10,423.70 | 10,497.12 |
| Camarilla | 10,312.32 | 10,322.72 | 10,333.13 | 10,343.53 | 10,353.94 | 10,364.34 | 10,374.75 |
| Woodie | 10,173.27 | 10,205.01 | 10,286.78 | 10,318.52 | 10,400.29 | 10,432.03 | 10,513.80 |
| Fibonacci | 10,196.68 | 10,240.04 | 10,266.83 | 10,310.19 | 10,353.55 | 10,380.34 | 10,423.70 |
| Pivot points | S3 | S2 | S1 | PP | R1 | R2 | R3 |
|---|---|---|---|---|---|---|---|
| Standard | 8,958.03 | 9,463.94 | 9,718.41 | 10,224.32 | 10,478.79 | 10,984.70 | 11,239.17 |
| Camarilla | 9,763.78 | 9,833.48 | 9,903.18 | 9,972.88 | 10,042.58 | 10,112.28 | 10,181.99 |
| Woodie | 8,832.31 | 9,401.08 | 9,592.69 | 10,161.46 | 10,353.07 | 10,921.84 | 11,113.45 |
| Fibonacci | 9,463.94 | 9,754.41 | 9,933.86 | 10,224.32 | 10,514.79 | 10,694.24 | 10,984.70 |
Numerical data
The following are the details of the technical indicators and moving averages that were collected to generate this technical analysis:
| RSI (14): | 54.32 | |
| MACD (12,26,9): | -2.9600 | |
| Directional Movement: | 6.11 | |
| AROON (14): | 71.42 | |
| DEMA (21): | 10,328.19 | |
| Parabolic SAR (0,02-0,02-0,2): | 10,250.18 | |
| Elder Ray (13): | 97.92 | |
| Super Trend (3,10): | 10,193.58 | |
| Zig ZAG (10): | 10,442.51 | |
| VORTEX (21): | 0.9800 | |
| Stochastique (14,3,5): | 87.66 | |
| TEMA (21): | 10,410.54 | |
| Williams %R (14): | -15.88 | |
| Chande Momentum Oscillator (20): | 472.59 | |
| Repulse (5,40,3): | 0.0500 | |
| ROCnROLL: | -1 | |
| TRIX (15,9): | -0.0800 | |
| Courbe Coppock: | 5.05 |
| MA7: | 10,415.43 | |
| MA20: | 10,268.14 | |
| MA50: | 10,495.66 | |
| MA100: | 10,768.79 | |
| MAexp7: | 10,413.77 | |
| MAexp20: | 10,360.48 | |
| MAexp50: | 10,473.49 | |
| MAexp100: | 10,621.54 | |
| Price / MA7: | +0.39% | |
| Price / MA20: | +1.83% | |
| Price / MA50: | -0.38% | |
| Price / MA100: | -2.90% | |
| Price / MAexp7: | +0.41% | |
| Price / MAexp20: | +0.92% | |
| Price / MAexp50: | -0.17% | |
| Price / MAexp100: | -1.56% |
About author

Online


Add a comment
Comments
0 comments on the analysis OMX HELSINKI_PI - Daily