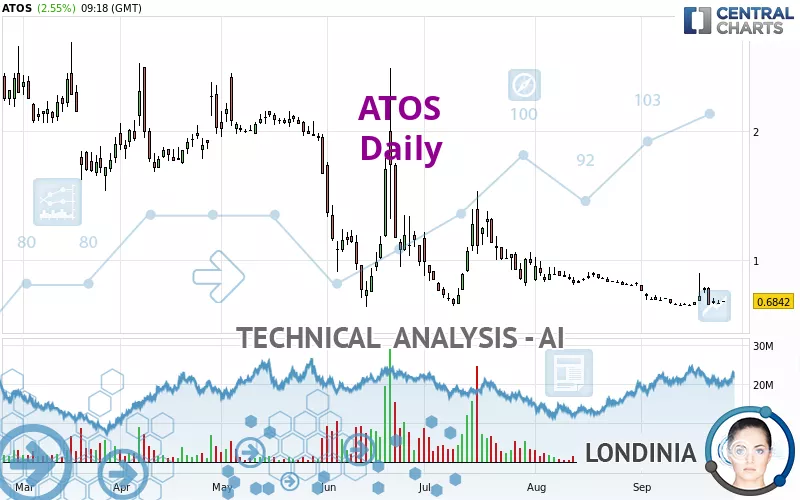
ATOS - Daily - Technical analysis published on 09/25/2024 (GMT)
- 146
- 0
Click here for a new analysis!
- Timeframe : Daily
- - Analysis generated on
- Status : LEVEL MAINTAINED

Summary of the analysis

Additional analysis
Quotes
The ATOS rating is 0.6842 EUR. On the day, this instrument gained +2.55% and was traded between 0.6738 EUR and 0.6842 EUR over the period. The price is currently at +1.54% from its lowest and 0% from its highest.The Central Gaps scanner detects a bullish opening. A small advantage for buyers in the very short term.
Bullish opening
Type : Bullish
Timeframe : Openning
A study of price movements over other periods shows the following variations:
Near a new LOW record (5 years)
Type : Bearish
Timeframe : Weekly
Near a new LOW record (1 month)
Type : Bearish
Timeframe : Weekly
Technical
Technical analysis of this Daily chart of ATOS indicates that the overall trend is strongly bearish. 92.86% of the signals given by moving averages are bearish. This strongly bearish trend is supported by the strong bearish signals given by short-term moving averages. There is no crossing of moving average by the price or crossing of moving averages between themselves.
On the 18 technical indicators analysed, 6 are bullish, 5 are neutral and 7 are bearish. But beware of excesses. The Central Indicators scanner currently detects this:
Williams %R indicator is oversold : under -80
Type : Neutral
Timeframe : Daily
Pivot points : price is over resistance 1
Type : Neutral
Timeframe : Daily
An analysis of the price chart with the Central Patterns scanner (detector of chart patterns and resistances and supports) shows a result that can have an impact on the price change:
Near support of triangle
Type : Bullish
Timeframe : Daily
The Central Candlesticks scanner, specialised in Japanese candlesticks, did not identify any signals.
| S1 | Price | R1 | R2 | R3 | |
|---|---|---|---|---|---|
| ProTrendLines | 0.6600 | 0.6842 | 1.7118 | 3.4100 | 4.4480 |
| Change (%) | -3.54% | - | +150.19% | +398.39% | +550.10% |
| Change | -0.0242 | - | +1.0276 | +2.7258 | +3.7638 |
| Level | Major | - | Major | Minor | Intermediate |
Attention could also be paid to pivot points to set price objectives:
| Pivot points | S3 | S2 | S1 | PP | R1 | R2 | R3 |
|---|---|---|---|---|---|---|---|
| Standard | 0.6331 | 0.6491 | 0.6581 | 0.6741 | 0.6831 | 0.6991 | 0.7081 |
| Camarilla | 0.6603 | 0.6626 | 0.6649 | 0.6672 | 0.6695 | 0.6718 | 0.6741 |
| Woodie | 0.6297 | 0.6474 | 0.6547 | 0.6724 | 0.6797 | 0.6974 | 0.7047 |
| Fibonacci | 0.6491 | 0.6586 | 0.6645 | 0.6741 | 0.6836 | 0.6895 | 0.6991 |
| Pivot points | S3 | S2 | S1 | PP | R1 | R2 | R3 |
|---|---|---|---|---|---|---|---|
| Standard | 0.3183 | 0.4839 | 0.5689 | 0.7345 | 0.8195 | 0.9851 | 1.0701 |
| Camarilla | 0.5851 | 0.6081 | 0.6310 | 0.6540 | 0.6770 | 0.6999 | 0.7229 |
| Woodie | 0.2781 | 0.4638 | 0.5287 | 0.7144 | 0.7793 | 0.9650 | 1.0299 |
| Fibonacci | 0.4839 | 0.5796 | 0.6387 | 0.7345 | 0.8302 | 0.8893 | 0.9851 |
| Pivot points | S3 | S2 | S1 | PP | R1 | R2 | R3 |
|---|---|---|---|---|---|---|---|
| Standard | 0.5104 | 0.6552 | 0.7374 | 0.8822 | 0.9644 | 1.1092 | 1.1914 |
| Camarilla | 0.7572 | 0.7780 | 0.7988 | 0.8196 | 0.8404 | 0.8612 | 0.8820 |
| Woodie | 0.4791 | 0.6396 | 0.7061 | 0.8666 | 0.9331 | 1.0936 | 1.1601 |
| Fibonacci | 0.6552 | 0.7419 | 0.7955 | 0.8822 | 0.9689 | 1.0225 | 1.1092 |
Numerical data
The following is the status of technical indicators and moving averages registered at the time this technical analysis was created:
| RSI (14): | 42.85 | |
| MACD (12,26,9): | -0.0435 | |
| Directional Movement: | 5.0217 | |
| AROON (14): | 21.4286 | |
| DEMA (21): | 0.6515 | |
| Parabolic SAR (0,02-0,02-0,2): | 0.8855 | |
| Elder Ray (13): | -0.0153 | |
| Super Trend (3,10): | 0.6109 | |
| Zig ZAG (10): | 0.6822 | |
| VORTEX (21): | 0.7985 | |
| Stochastique (14,3,5): | 9.20 | |
| TEMA (21): | 0.6651 | |
| Williams %R (14): | -86.84 | |
| Chande Momentum Oscillator (20): | -0.0174 | |
| Repulse (5,40,3): | -10.8625 | |
| ROCnROLL: | 2 | |
| TRIX (15,9): | -0.9299 | |
| Courbe Coppock: | 12.58 |
| MA7: | 0.6945 | |
| MA20: | 0.7026 | |
| MA50: | 0.8327 | |
| MA100: | 1.1076 | |
| MAexp7: | 0.6839 | |
| MAexp20: | 0.7147 | |
| MAexp50: | 0.8424 | |
| MAexp100: | 1.2257 | |
| Price / MA7: | -1.48% | |
| Price / MA20: | -2.62% | |
| Price / MA50: | -17.83% | |
| Price / MA100: | -38.23% | |
| Price / MAexp7: | +0.04% | |
| Price / MAexp20: | -4.27% | |
| Price / MAexp50: | -18.78% | |
| Price / MAexp100: | -44.18% |
News
The last news published on ATOS at the time of the generation of this analysis was as follows:
- Extension of the accelerated safeguard proceedings period
- Availability of the adjusted draft accelerated safeguard plan
- Convening of Atos shareholders and creditors gathered in classes of affected parties to vote on the draft accelerated safeguard plan
- Atos Market Update - September 2, 2024
- Reduction of Resources for the Liquidity Contract Agreement with Rothschild Martin Maurel
About author
Online


Add a comment
Comments
0 comments on the analysis ATOS - Daily