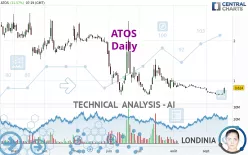
ATOS - Daily - Technical analysis published on 09/18/2024 (GMT)
- 159
- 0
Click here for a new analysis!
- Timeframe : Daily
- - Analysis generated on
- Status : TARGET REACHED

Summary of the analysis

Additional analysis
Quotes
The ATOS rating is 0.8240 EUR. The price has increased by +21.57% since the last closing and was between 0.6870 EUR and 0.8240 EUR. This implies that the price is at +19.94% from its lowest and at 0% from its highest.A bullish gap was detected at the opening by the Central Gaps scanner. There are a lot of buyers and they have the upper hand in the very short term.
Opening Gap UP
Type : Bullish
Timeframe : Openning
A study of price movements over other periods shows the following variations:
Near a new LOW record (5 years)
Type : Bearish
Timeframe : Weekly
Technical
A technical analysis in Daily of this ATOS chart shows a bearish trend. The signals given by moving averages are 67.86% bearish. This bearish trend could slow down given the neutral signals currently being given by short-term moving averages. An assessment of moving averages reveals several bullish signals that could impact this trend:
Bullish trend reversal : Moving Average 50
Type : Bullish
Timeframe : Daily
Bullish price crossover with Moving Average 20
Type : Bullish
Timeframe : Daily
Bullish price crossover with adaptative moving average 20
Type : Bullish
Timeframe : Daily
On the 18 technical indicators analysed, 7 are bullish, 7 are neutral and 4 are bearish. Central Indicators, the scanner specialised in technical indicators, has identified these signals:
Pivot points : price is over resistance 3
Type : Neutral
Timeframe : Daily
Pivot points : price is over resistance 3
Type : Neutral
Timeframe : Weekly
RSI indicator is back over 50
Type : Bullish
Timeframe : Daily
MACD crosses UP its Moving Average
Type : Bullish
Timeframe : Daily
Parabolic SAR indicator bullish reversal
Type : Bullish
Timeframe : Daily
SuperTrend indicator bullish reversal
Type : Bullish
Timeframe : Daily
Momentum indicator is back over 0
Type : Bullish
Timeframe : Daily
Williams %R indicator is back over -50
Type : Bullish
Timeframe : Daily
The Central Patterns scanner, which studies chart patterns, resistances and supports, has identified this signal:
Near support of triangle
Type : Bullish
Timeframe : Daily
The presence of these bullish Japanese candlestick patterns detected by Central Candlesticks that could cause a very short term rebound were also noted:
White line without lower shadow
Type : Bullish
Timeframe : Daily
Upside gap
Type : Bullish
Timeframe : Daily
| S1 | Price | R1 | R2 | R3 | |
|---|---|---|---|---|---|
| ProTrendLines | 0.6650 | 0.8240 | 1.7118 | 3.4100 | 4.4480 |
| Change (%) | -19.30% | - | +107.74% | +313.83% | +439.81% |
| Change | -0.1590 | - | +0.8878 | +2.5860 | +3.6240 |
| Level | Major | - | Intermediate | Minor | Minor |
To determine price objectives, it is also possible to use the pivot points. Here is the price position in relation to pivot points:
| Pivot points | S3 | S2 | S1 | PP | R1 | R2 | R3 |
|---|---|---|---|---|---|---|---|
| Standard | 0.6305 | 0.6399 | 0.6589 | 0.6683 | 0.6873 | 0.6967 | 0.7157 |
| Camarilla | 0.6700 | 0.6726 | 0.6752 | 0.6778 | 0.6804 | 0.6830 | 0.6856 |
| Woodie | 0.6352 | 0.6423 | 0.6636 | 0.6707 | 0.6920 | 0.6991 | 0.7204 |
| Fibonacci | 0.6399 | 0.6508 | 0.6575 | 0.6683 | 0.6792 | 0.6859 | 0.6967 |
| Pivot points | S3 | S2 | S1 | PP | R1 | R2 | R3 |
|---|---|---|---|---|---|---|---|
| Standard | 0.5731 | 0.6111 | 0.6333 | 0.6713 | 0.6935 | 0.7315 | 0.7537 |
| Camarilla | 0.6389 | 0.6444 | 0.6499 | 0.6554 | 0.6609 | 0.6664 | 0.6720 |
| Woodie | 0.5651 | 0.6072 | 0.6253 | 0.6674 | 0.6855 | 0.7276 | 0.7457 |
| Fibonacci | 0.6111 | 0.6341 | 0.6483 | 0.6713 | 0.6943 | 0.7085 | 0.7315 |
| Pivot points | S3 | S2 | S1 | PP | R1 | R2 | R3 |
|---|---|---|---|---|---|---|---|
| Standard | 0.5104 | 0.6552 | 0.7374 | 0.8822 | 0.9644 | 1.1092 | 1.1914 |
| Camarilla | 0.7572 | 0.7780 | 0.7988 | 0.8196 | 0.8404 | 0.8612 | 0.8820 |
| Woodie | 0.4791 | 0.6396 | 0.7061 | 0.8666 | 0.9331 | 1.0936 | 1.1601 |
| Fibonacci | 0.6552 | 0.7419 | 0.7955 | 0.8822 | 0.9689 | 1.0225 | 1.1092 |
Numerical data
The following are the details of the technical indicators and moving averages that were collected to generate this technical analysis:
| RSI (14): | 48.21 | |
| MACD (12,26,9): | -0.0553 | |
| Directional Movement: | 9.1683 | |
| AROON (14): | -71.4285 | |
| DEMA (21): | 0.6659 | |
| Parabolic SAR (0,02-0,02-0,2): | 0.6492 | |
| Elder Ray (13): | 0.0285 | |
| Super Trend (3,10): | 0.6201 | |
| Zig ZAG (10): | 0.7902 | |
| VORTEX (21): | 0.7048 | |
| Stochastique (14,3,5): | 28.76 | |
| TEMA (21): | 0.6679 | |
| Williams %R (14): | -27.12 | |
| Chande Momentum Oscillator (20): | 0.0232 | |
| Repulse (5,40,3): | 16.7199 | |
| ROCnROLL: | -1 | |
| TRIX (15,9): | -1.0427 | |
| Courbe Coppock: | 29.04 |
| MA7: | 0.6799 | |
| MA20: | 0.7366 | |
| MA50: | 0.8761 | |
| MA100: | 1.1767 | |
| MAexp7: | 0.7047 | |
| MAexp20: | 0.7347 | |
| MAexp50: | 0.8772 | |
| MAexp100: | 1.2781 | |
| Price / MA7: | +21.19% | |
| Price / MA20: | +11.87% | |
| Price / MA50: | -5.95% | |
| Price / MA100: | -29.97% | |
| Price / MAexp7: | +16.93% | |
| Price / MAexp20: | +12.15% | |
| Price / MAexp50: | -6.06% | |
| Price / MAexp100: | -35.53% |
News
Don't forget to follow the news on ATOS. At the time of publication of this analysis, the latest news was as follows:
- Availability of the adjusted draft accelerated safeguard plan
- Convening of Atos shareholders and creditors gathered in classes of affected parties to vote on the draft accelerated safeguard plan
- Atos Market Update - September 2, 2024
- Reduction of Resources for the Liquidity Contract Agreement with Rothschild Martin Maurel
- Atos press release : H1 2024 results
About author
Online


Add a comment
Comments
0 comments on the analysis ATOS - Daily