ATOS - 1H - Technical analysis published on 06/17/2024 (GMT)
- 202
- 0
Click here for a new analysis!
- Timeframe : 1H
- - Analysis generated on
- Status : TARGET REACHED
Summary of the analysis

Additional analysis
Quotes
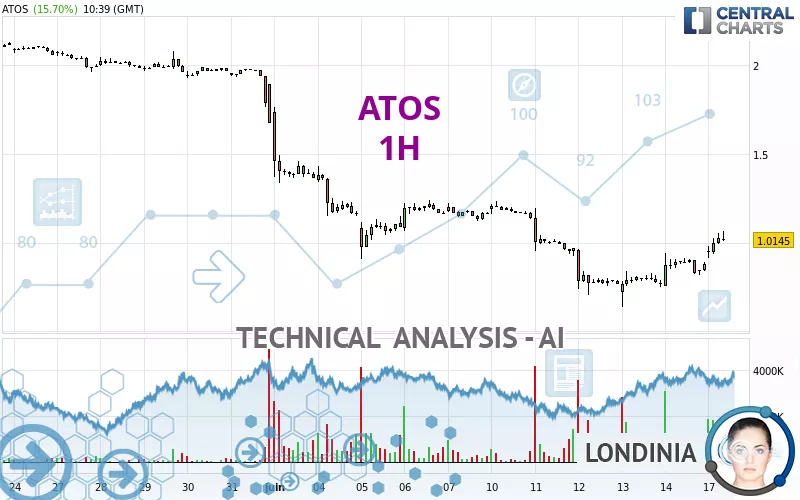
The ATOS rating is 1.0355 EUR. The price registered an increase of +18.10% on the session with the lowest point at 0.9142 EUR and the highest point at 1.0550 EUR. The deviation from the price is +13.27% for the low point and -1.85% for the high point.The Central Gaps scanner detects a bullish gap which is a sign that buyers have taken the lead in the very short term.
Opening Gap UP
Type : Bullish
Timeframe : Openning
Here is a more detailed summary of the historical variations registered by ATOS:
Abnormal volumes
Timeframe : 5 days
Abnormal volumes
Timeframe : 20 days
Technical
Technical analysis of ATOS in 1H shows an overall slightly bearish trend. Only 57.14% of the signals given by moving averages are bearish. This slightly bearish trend could quickly be reversed due to the strong bullish signals currently being given by short-term moving averages. There is no crossing of moving average by the price or crossing of moving averages between themselves.
The probability of a further increase is high given the direction of the technical indicators.
But beware of excesses. The Central Indicators scanner currently detects this:
CCI indicator is overbought : over 100
Type : Neutral
Timeframe : 1 hour
Previous candle closed over Bollinger bands
Type : Neutral
Timeframe : 1 hour
CCI indicator: bearish divergence
Type : Bearish
Timeframe : 1 hour
Williams %R indicator is overbought : over -20
Type : Neutral
Timeframe : 1 hour
Pivot points : price is over resistance 1
Type : Neutral
Timeframe : 1 hour
Central Patterns, the scanner specializing in chart patterns, did not identify any signals.
The Central Candlesticks scanner, specialised in Japanese candlesticks, did not identify any signals.
| S2 | S1 | Price | R1 | R2 | R3 | |
|---|---|---|---|---|---|---|
| ProTrendLines | 0.7482 | 0.9110 | 1.0355 | 1.2359 | 1.9639 | 2.1198 |
| Change (%) | -27.75% | -12.02% | - | +19.35% | +89.66% | +104.71% |
| Change | -0.2873 | -0.1245 | - | +0.2004 | +0.9284 | +1.0843 |
| Level | Intermediate | Minor | - | Minor | Minor | Intermediate |
Attention could also be paid to pivot points to set price objectives:
| Pivot points | S3 | S2 | S1 | PP | R1 | R2 | R3 |
|---|---|---|---|---|---|---|---|
| Standard | 0.5885 | 0.6713 | 0.7741 | 0.8569 | 0.9597 | 1.0425 | 1.1453 |
| Camarilla | 0.8258 | 0.8428 | 0.8598 | 0.8768 | 0.8938 | 0.9108 | 0.9278 |
| Woodie | 0.5984 | 0.6763 | 0.7840 | 0.8619 | 0.9696 | 1.0475 | 1.1552 |
| Fibonacci | 0.6713 | 0.7422 | 0.7860 | 0.8569 | 0.9278 | 0.9716 | 1.0425 |
| Pivot points | S3 | S2 | S1 | PP | R1 | R2 | R3 |
|---|---|---|---|---|---|---|---|
| Standard | -0.0001 | 0.3185 | 0.5977 | 0.9163 | 1.1955 | 1.5141 | 1.7933 |
| Camarilla | 0.7124 | 0.7672 | 0.8220 | 0.8768 | 0.9316 | 0.9864 | 1.0412 |
| Woodie | -0.0199 | 0.3087 | 0.5779 | 0.9065 | 1.1757 | 1.5043 | 1.7735 |
| Fibonacci | 0.3185 | 0.5469 | 0.6880 | 0.9163 | 1.1447 | 1.2858 | 1.5141 |
| Pivot points | S3 | S2 | S1 | PP | R1 | R2 | R3 |
|---|---|---|---|---|---|---|---|
| Standard | 0.6323 | 1.1517 | 1.4113 | 1.9307 | 2.1903 | 2.7097 | 2.9693 |
| Camarilla | 1.4568 | 1.5282 | 1.5996 | 1.6710 | 1.7424 | 1.8138 | 1.8852 |
| Woodie | 0.5025 | 1.0868 | 1.2815 | 1.8658 | 2.0605 | 2.6448 | 2.8395 |
| Fibonacci | 1.1517 | 1.4492 | 1.6331 | 1.9307 | 2.2282 | 2.4121 | 2.7097 |
Numerical data
The following is the status of technical indicators and moving averages registered at the time this technical analysis was created:
| RSI (14): | 67.77 | |
| MACD (12,26,9): | 0.0258 | |
| Directional Movement: | 16.2985 | |
| AROON (14): | 85.7142 | |
| DEMA (21): | 0.9219 | |
| Parabolic SAR (0,02-0,02-0,2): | 0.8108 | |
| Elder Ray (13): | 0.1019 | |
| Super Trend (3,10): | 0.8576 | |
| Zig ZAG (10): | 1.0370 | |
| VORTEX (21): | 1.2970 | |
| Stochastique (14,3,5): | 92.26 | |
| TEMA (21): | 0.9893 | |
| Williams %R (14): | -6.03 | |
| Chande Momentum Oscillator (20): | 0.1675 | |
| Repulse (5,40,3): | 7.7657 | |
| ROCnROLL: | 1 | |
| TRIX (15,9): | -0.0573 | |
| Courbe Coppock: | 37.47 |
| MA7: | 0.9597 | |
| MA20: | 1.4695 | |
| MA50: | 1.7778 | |
| MA100: | 2.1273 | |
| MAexp7: | 0.9661 | |
| MAexp20: | 0.9047 | |
| MAexp50: | 0.9561 | |
| MAexp100: | 1.1405 | |
| Price / MA7: | +7.90% | |
| Price / MA20: | -29.53% | |
| Price / MA50: | -41.75% | |
| Price / MA100: | -51.32% | |
| Price / MAexp7: | +7.18% | |
| Price / MAexp20: | +14.46% | |
| Price / MAexp50: | +8.30% | |
| Price / MAexp100: | -9.21% |
News
Don't forget to follow the news on ATOS. At the time of publication of this analysis, the latest news was as follows:
- Market Update - June 14, 2024
- Atos enters into exclusive negotiations with ALTEN for the sale of Worldgrid
- Market Update
- Availability of the Universal Registration Document 2023
- Atos - Market Update 21 May 2024
About author
Online


Add a comment
Comments
0 comments on the analysis ATOS - 1H