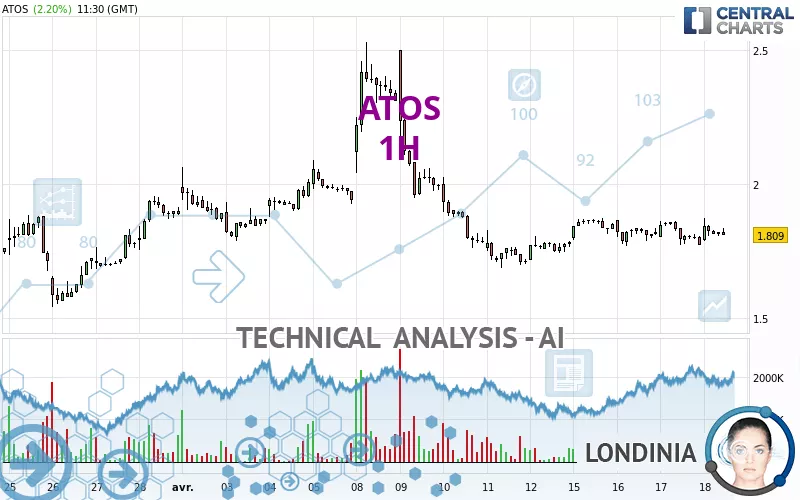
ATOS - 1H - Technical analysis published on 04/18/2024 (GMT)
- 218
- 0
Click here for a new analysis!
- Timeframe : 1H
- - Analysis generated on
- Status : INVALID
Summary of the analysis

Additional analysis
Quotes
The ATOS price is 1.8165 EUR. On the day, this instrument gained +2.63% with the lowest point at 1.7860 EUR and the highest point at 1.8740 EUR. The deviation from the price is +1.71% for the low point and -3.07% for the high point.The Central Gaps scanner detects a bullish opening. A small advantage for buyers in the very short term.
Bullish opening
Type : Bullish
Timeframe : Openning
So that you have an overall view of the price change, here is a table showing the variations over several periods:
Technical
Technical analysis of this 1H chart of ATOS indicates that the overall trend is bearish. 75.00% of the signals given by moving averages are bearish. This bearish trend is slowing down slightly given the slightly bearish signals given by short-term moving averages. The Central Indicators scanner detects bearish signals on moving averages that could impact this trend:
Bearish trend reversal : Moving Average 100
Type : Bearish
Timeframe : 1 hour
Bearish price crossover with Moving Average 20
Type : Bearish
Timeframe : 1 hour
On the 18 technical indicators analysed, 6 are bullish, 8 are neutral and 4 are bearish. The Central Indicators scanner found this result concerning these indicators:
RSI indicator is back under 50
Type : Bearish
Timeframe : 1 hour
Central Patterns, the market scanner focusing on chart patterns, resistances and supports found this result:
Near resistance of channel
Type : Bearish
Timeframe : 1 hour
Central Candlesticks, the scanner specialised in Japanese candlesticks, detects a bearish signal that could support the hypothesis of a small drop in the very short term:
Black gravestone / inverted hammer
Type : Bearish
Timeframe : 1 hour
| S2 | S1 | Price | R1 | R2 | R3 | |
|---|---|---|---|---|---|---|
| ProTrendLines | 1.5400 | 1.7688 | 1.8165 | 1.8779 | 2.0640 | 2.3593 |
| Change (%) | -15.22% | -2.63% | - | +3.38% | +13.63% | +29.88% |
| Change | -0.2765 | -0.0477 | - | +0.0614 | +0.2475 | +0.5428 |
| Level | Minor | Intermediate | - | Major | Minor | Minor |
To determine price objectives, it is also possible to use the pivot points. Here is the price position in relation to pivot points:
| Pivot points | S3 | S2 | S1 | PP | R1 | R2 | R3 |
|---|---|---|---|---|---|---|---|
| Standard | 1.6487 | 1.7093 | 1.7397 | 1.8003 | 1.8307 | 1.8913 | 1.9217 |
| Camarilla | 1.7450 | 1.7533 | 1.7617 | 1.7700 | 1.7783 | 1.7867 | 1.7950 |
| Woodie | 1.6335 | 1.7018 | 1.7245 | 1.7928 | 1.8155 | 1.8838 | 1.9065 |
| Fibonacci | 1.7093 | 1.7441 | 1.7656 | 1.8003 | 1.8351 | 1.8566 | 1.8913 |
| Pivot points | S3 | S2 | S1 | PP | R1 | R2 | R3 |
|---|---|---|---|---|---|---|---|
| Standard | 0.6227 | 1.1533 | 1.4687 | 1.9993 | 2.3147 | 2.8453 | 3.1607 |
| Camarilla | 1.5514 | 1.6289 | 1.7065 | 1.7840 | 1.8616 | 1.9391 | 2.0167 |
| Woodie | 0.5150 | 1.0995 | 1.3610 | 1.9455 | 2.2070 | 2.7915 | 3.0530 |
| Fibonacci | 1.1533 | 1.4765 | 1.6762 | 1.9993 | 2.3225 | 2.5222 | 2.8453 |
| Pivot points | S3 | S2 | S1 | PP | R1 | R2 | R3 |
|---|---|---|---|---|---|---|---|
| Standard | 0.2427 | 0.8913 | 1.3947 | 2.0433 | 2.5467 | 3.1953 | 3.6987 |
| Camarilla | 1.5812 | 1.6868 | 1.7924 | 1.8980 | 2.0036 | 2.1092 | 2.2148 |
| Woodie | 0.1700 | 0.8550 | 1.3220 | 2.0070 | 2.4740 | 3.1590 | 3.6260 |
| Fibonacci | 0.8913 | 1.3314 | 1.6033 | 2.0433 | 2.4834 | 2.7553 | 3.1953 |
Numerical data
The following are the details of the technical indicators and moving averages that were collected to generate this technical analysis:
| RSI (14): | 49.40 | |
| MACD (12,26,9): | -0.0029 | |
| Directional Movement: | 1.7395 | |
| AROON (14): | 7.1429 | |
| DEMA (21): | 1.8144 | |
| Parabolic SAR (0,02-0,02-0,2): | 1.7761 | |
| Elder Ray (13): | 0.0096 | |
| Super Trend (3,10): | 1.7664 | |
| Zig ZAG (10): | 1.8200 | |
| VORTEX (21): | 1.0374 | |
| Stochastique (14,3,5): | 46.63 | |
| TEMA (21): | 1.8206 | |
| Williams %R (14): | -51.92 | |
| Chande Momentum Oscillator (20): | -0.0295 | |
| Repulse (5,40,3): | -0.4494 | |
| ROCnROLL: | -1 | |
| TRIX (15,9): | -0.0129 | |
| Courbe Coppock: | 1.26 |
| MA7: | 1.7911 | |
| MA20: | 1.8400 | |
| MA50: | 2.1106 | |
| MA100: | 3.8264 | |
| MAexp7: | 1.8172 | |
| MAexp20: | 1.8181 | |
| MAexp50: | 1.8355 | |
| MAexp100: | 1.8685 | |
| Price / MA7: | +1.42% | |
| Price / MA20: | -1.28% | |
| Price / MA50: | -13.93% | |
| Price / MA100: | -52.53% | |
| Price / MAexp7: | -0.04% | |
| Price / MAexp20: | -0.09% | |
| Price / MAexp50: | -1.04% | |
| Price / MAexp100: | -2.78% |
News
The latest news and videos published on ATOS at the time of the analysis were as follows:
- Atos announces the evolution of its Board of Directors
- Market Update
- Atos reshapes management team and board to implement adjusted strategy
- Atos Group strengthens management team to lead transformation
- Eviden and Amazon Web Services (AWS) create new collaboration to accelerate creation of AI-driven, secure and sustainable industry solutions on AWS Marketplace
About author
Online


Add a comment
Comments
0 comments on the analysis ATOS - 1H