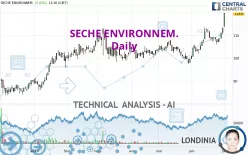
SECHE ENVIRONNEM. - Daily - Technical analysis published on 07/03/2023 (GMT)
- 220
- 0
Click here for a new analysis!
- Timeframe : Daily
- - Analysis generated on
- Status : LEVEL MAINTAINED

Summary of the analysis

Additional analysis
Quotes
The SECHE ENVIRONNEM. price is 119.8 EUR. The price has increased by +5.83% since the last closing and was traded between 113.8 EUR and 119.8 EUR over the period. The price is currently at +5.27% from its lowest and 0% from its highest.The Central Gaps scanner detects the formation of a bullish gap marking the strong presence of buyers against sellers at the opening. This formed a quotation gap.
Opening Gap UP
Type : Bullish
Timeframe : Openning
So that you have an overall view of the price change, here is a table showing the variations over several periods:
New HIGH record (5 years)
Type : Bullish
Timeframe : Weekly
New HIGH record (1 year)
Type : Bullish
Timeframe : Weekly
New HIGH record (1st january)
Type : Bullish
Timeframe : Weekly
New HIGH record (1 month)
Type : Bullish
Timeframe : Weekly
Technical
Technical analysis of SECHE ENVIRONNEM. in Daily shows a strongly overall bullish trend. 92.86% of the signals given by moving averages are bullish. This strongly bullish trend is supported by the strong bullish signals given by short-term moving averages. There is no crossing of moving average by the price or crossing of moving averages between themselves.
In fact, 15 technical indicators on 18 studied are currently positioned bullish. Caution: the Central Indicators scanner currently detects an excess:
RSI indicator is overbought : over 70
Type : Neutral
Timeframe : Daily
CCI indicator is overbought : over 100
Type : Neutral
Timeframe : Daily
Williams %R indicator is overbought : over -20
Type : Neutral
Timeframe : Daily
Pivot points : price is over resistance 2
Type : Neutral
Timeframe : Weekly
Pivot points : price is over resistance 3
Type : Neutral
Timeframe : Daily
An analysis of the price chart with the Central Patterns scanner (detector of chart patterns and resistances and supports) shows a result that can have an impact on the price change:
Resistance of channel is broken
Type : Bullish
Timeframe : Daily
For a small rebound in the very short term, the Central Candlesticks scanner currently notes the presence of this bullish pattern in Japanese candlesticks:
Upside gap
Type : Bullish
Timeframe : Daily
| S3 | S2 | S1 | Price | |
|---|---|---|---|---|
| ProTrendLines | 86.3 | 99.7 | 110.6 | 119.8 |
| Change (%) | -27.96% | -16.78% | -7.68% | - |
| Change | -33.5 | -20.1 | -9.2 | - |
| Level | Major | Major | Major | - |
To determine price objectives, it is also possible to use the pivot points. Here is the price position in relation to pivot points:
| Pivot points | S3 | S2 | S1 | PP | R1 | R2 | R3 |
|---|---|---|---|---|---|---|---|
| Standard | 108.0 | 109.2 | 111.2 | 112.4 | 114.4 | 115.6 | 117.6 |
| Camarilla | 112.3 | 112.6 | 112.9 | 113.2 | 113.5 | 113.8 | 114.1 |
| Woodie | 108.4 | 109.4 | 111.6 | 112.6 | 114.8 | 115.8 | 118.0 |
| Fibonacci | 109.2 | 110.4 | 111.2 | 112.4 | 113.6 | 114.4 | 115.6 |
| Pivot points | S3 | S2 | S1 | PP | R1 | R2 | R3 |
|---|---|---|---|---|---|---|---|
| Standard | 100.7 | 103.3 | 108.3 | 110.9 | 115.9 | 118.5 | 123.5 |
| Camarilla | 111.1 | 111.8 | 112.5 | 113.2 | 113.9 | 114.6 | 115.3 |
| Woodie | 101.8 | 103.9 | 109.4 | 111.5 | 117.0 | 119.1 | 124.6 |
| Fibonacci | 103.3 | 106.2 | 108.0 | 110.9 | 113.8 | 115.6 | 118.5 |
| Pivot points | S3 | S2 | S1 | PP | R1 | R2 | R3 |
|---|---|---|---|---|---|---|---|
| Standard | 90.0 | 94.8 | 104.0 | 108.8 | 118.0 | 122.8 | 132.0 |
| Camarilla | 109.4 | 110.6 | 111.9 | 113.2 | 114.5 | 115.8 | 117.1 |
| Woodie | 92.2 | 95.9 | 106.2 | 109.9 | 120.2 | 123.9 | 134.2 |
| Fibonacci | 94.8 | 100.2 | 103.5 | 108.8 | 114.2 | 117.5 | 122.8 |
Numerical data
The following are the details of the technical indicators and moving averages that were collected to generate this technical analysis:
| RSI (14): | 76.60 | |
| MACD (12,26,9): | 2.5000 | |
| Directional Movement: | 31.0 | |
| AROON (14): | 35.7 | |
| DEMA (21): | 112.2 | |
| Parabolic SAR (0,02-0,02-0,2): | 106.2 | |
| Elder Ray (13): | 6.2 | |
| Super Trend (3,10): | 108.8 | |
| Zig ZAG (10): | 119.6 | |
| VORTEX (21): | 1.2000 | |
| Stochastique (14,3,5): | 88.00 | |
| TEMA (21): | 113.7 | |
| Williams %R (14): | -1.40 | |
| Chande Momentum Oscillator (20): | 7.2 | |
| Repulse (5,40,3): | 10.1000 | |
| ROCnROLL: | 1 | |
| TRIX (15,9): | 0.2000 | |
| Courbe Coppock: | 8.80 |
| MA7: | 110.9 | |
| MA20: | 108.9 | |
| MA50: | 105.4 | |
| MA100: | 104.5 | |
| MAexp7: | 112.5 | |
| MAexp20: | 109.3 | |
| MAexp50: | 106.4 | |
| MAexp100: | 103.4 | |
| Price / MA7: | +8.03% | |
| Price / MA20: | +10.01% | |
| Price / MA50: | +13.66% | |
| Price / MA100: | +14.64% | |
| Price / MAexp7: | +6.49% | |
| Price / MAexp20: | +9.61% | |
| Price / MAexp50: | +12.59% | |
| Price / MAexp100: | +15.86% |
News
The last news published on SECHE ENVIRONNEM. at the time of the generation of this analysis was as follows:
- Séché Environnement: Joint General Meeting of April 28, 2023
- Séché Environnement: Information on the Governance Code
- Séché Environnement: Activity in Q1 2023
- Séché Environnement: Release of the Universal Registration Document Including the Annual Financial Report
- Séché Environnement: Consolidated Results at December 31, 2022
About author
Online


Add a comment
Comments
0 comments on the analysis SECHE ENVIRONNEM. - Daily