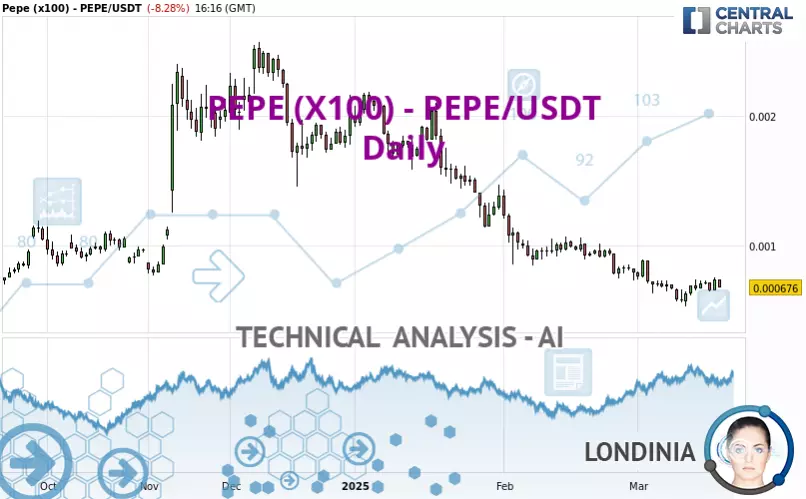
PEPE (X100) - PEPE/USDT - Daily - Technical analysis published on 03/18/2025 (GMT)
- 340
- 0
Click here for a new analysis!
- Timeframe : Daily
- - Analysis generated on
- Status : INVALID

Summary of the analysis

Additional analysis
Quotes
PEPE (X100) - PEPE/USDT rating 0.000676 USDT. The price registered a decrease of -8.28% on the session and was between 0.000674 USDT and 0.000740 USDT. This implies that the price is at +0.30% from its lowest and at -8.65% from its highest.The Central Gaps scanner detects a bullish opening. A small advantage for buyers in the very short term.
Bullish opening
Type : Bullish
Timeframe : Openning
Here is a more detailed summary of the historical variations registered by PEPE (X100) - PEPE/USDT:
Technical
Technical analysis of PEPE (X100) - PEPE/USDT in Daily shows a overall strongly bearish trend. 92.86% of the signals given by moving averages are bearish. This strongly bearish trend is supported by the strong bearish signals given by short-term moving averages. The Central Indicators market scanner is currently detecting several bearish and bullish signals that could impact this trend:
Moving Average bullish crossovers : AMA20 & AMA50
Type : Bullish
Timeframe : Daily
Bearish price crossover with Moving Average 20
Type : Bearish
Timeframe : Daily
The technical indicators are generally neutral. They do not provide relevant information on the direction of future price movements.
Central Indicators, the detector scanner for these technical indicators has recently detected several signals:
Pivot points : price is under support 1 (Daily)
Type : Neutral
Timeframe : Daily
Aroon indicator bullish trend
Type : Bullish
Timeframe : Daily
Momentum indicator is back under 0
Type : Bearish
Timeframe : Daily
The analysis of the price chart with Central Patterns scanners does not return any result.
No result was found by the Central Candlesticks scanner on Japanese candlesticks.
| S1 | Price | R1 | R2 | R3 | |
|---|---|---|---|---|---|
| ProTrendLines | 0.000575 | 0.000676 | 0.000890 | 0.001726 | 0.002032 |
| Change (%) | -14.94% | - | +31.66% | +155.33% | +200.59% |
| Change | -0.000101 | - | +0.000214 | +0.001050 | +0.001356 |
| Level | Intermediate | - | Intermediate | Minor | Minor |
Pivot points can also be used to set your price objectives. Here is the price situation in relation to pivot points:
| Pivot points | S3 | S2 | S1 | PP | R1 | R2 | R3 |
|---|---|---|---|---|---|---|---|
| Standard | 0.000579 | 0.000618 | 0.000678 | 0.000717 | 0.000777 | 0.000816 | 0.000876 |
| Camarilla | 0.000710 | 0.000719 | 0.000728 | 0.000737 | 0.000746 | 0.000755 | 0.000764 |
| Woodie | 0.000589 | 0.000623 | 0.000688 | 0.000722 | 0.000787 | 0.000821 | 0.000886 |
| Fibonacci | 0.000618 | 0.000656 | 0.000680 | 0.000717 | 0.000755 | 0.000779 | 0.000816 |
| Pivot points | S3 | S2 | S1 | PP | R1 | R2 | R3 |
|---|---|---|---|---|---|---|---|
| Standard | 0.000377 | 0.000454 | 0.000584 | 0.000661 | 0.000791 | 0.000868 | 0.000998 |
| Camarilla | 0.000656 | 0.000675 | 0.000694 | 0.000713 | 0.000732 | 0.000751 | 0.000770 |
| Woodie | 0.000403 | 0.000467 | 0.000610 | 0.000674 | 0.000817 | 0.000881 | 0.001024 |
| Fibonacci | 0.000454 | 0.000533 | 0.000582 | 0.000661 | 0.000740 | 0.000789 | 0.000868 |
| Pivot points | S3 | S2 | S1 | PP | R1 | R2 | R3 |
|---|---|---|---|---|---|---|---|
| Standard | -0.000160 | 0.000284 | 0.000538 | 0.000982 | 0.001236 | 0.001680 | 0.001934 |
| Camarilla | 0.000599 | 0.000663 | 0.000727 | 0.000791 | 0.000855 | 0.000919 | 0.000983 |
| Woodie | -0.000256 | 0.000237 | 0.000442 | 0.000935 | 0.001140 | 0.001633 | 0.001838 |
| Fibonacci | 0.000284 | 0.000551 | 0.000716 | 0.000982 | 0.001249 | 0.001414 | 0.001680 |
Numerical data
The following is the status of the technical indicators and moving averages at the time of publication of this technical analysis:
| RSI (14): | 42.44 | |
| MACD (12,26,9): | -0.0001 | |
| Directional Movement: | -8.915873 | |
| AROON (14): | 42.857143 | |
| DEMA (21): | 0.000623 | |
| Parabolic SAR (0,02-0,02-0,2): | 0.000575 | |
| Elder Ray (13): | 0.000010 | |
| Super Trend (3,10): | 0.000861 | |
| Zig ZAG (10): | 0.000674 | |
| VORTEX (21): | 0.9584 | |
| Stochastique (14,3,5): | 63.49 | |
| TEMA (21): | 0.000665 | |
| Williams %R (14): | -36.44 | |
| Chande Momentum Oscillator (20): | -0.000010 | |
| Repulse (5,40,3): | -7.8918 | |
| ROCnROLL: | 2 | |
| TRIX (15,9): | -1.4609 | |
| Courbe Coppock: | 17.69 |
| MA7: | 0.000693 | |
| MA20: | 0.000704 | |
| MA50: | 0.000886 | |
| MA100: | 0.001385 | |
| MAexp7: | 0.000688 | |
| MAexp20: | 0.000727 | |
| MAexp50: | 0.000922 | |
| MAexp100: | 0.001122 | |
| Price / MA7: | -2.45% | |
| Price / MA20: | -3.98% | |
| Price / MA50: | -23.70% | |
| Price / MA100: | -51.19% | |
| Price / MAexp7: | -1.74% | |
| Price / MAexp20: | -7.02% | |
| Price / MAexp50: | -26.68% | |
| Price / MAexp100: | -39.75% |
About author

Online


Add a comment
Comments
0 comments on the analysis PEPE (X100) - PEPE/USDT - Daily