| Open: | - |
| Change: | - |
| Volume: | - |
| Low: | - |
| High: | - |
| High / Low range: | - |
| Type: | Futures |
| Ticker: | MNQ0325 |
| ISIN: | MNQH5 |
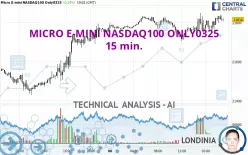
MICRO E-MINI NASDAQ100 ONLY0325 - 15 min. - Technical analysis published on 02/06/2025 (GMT)
- 118
- 0
- 02/06/2025 - 19:13
Click here for a new analysis!
- Timeframe : 15 min.
- - Analysis generated on 02/06/2025 - 19:13
- Status : LEVEL MAINTAINED

Summary of the analysis
Additional analysis
Quotes
The MICRO E-MINI NASDAQ100 ONLY0325 price is 21,816.00 USD. The price has increased by +0.24% since the last closing and was between 21,706.00 USD and 21,849.50 USD. This implies that the price is at +0.51% from its lowest and at -0.15% from its highest.The Central Gaps scanner detects a bullish opening. A small advantage for buyers in the very short term.
Bullish opening
Type : Bullish
Timeframe : Openning
Here is a more detailed summary of the historical variations registered by MICRO E-MINI NASDAQ100 ONLY0325:
Near a new HIGH record (5 years)
Type : Bullish
Timeframe : Weekly
Near a new HIGH record (1 year)
Type : Bullish
Timeframe : Weekly
Near a new LOW record (1st january)
Type : Bearish
Timeframe : Weekly
Near a new LOW record (1 month)
Type : Bearish
Timeframe : Weekly
Abnormal volumes on MICRO E-MINI NASDAQ100 ONLY0325 were detected by the Central Volumes scanner:
Abnormal volumes
Timeframe : 5 days
Abnormal volumes
Timeframe : 20 days
Abnormal volumes
Timeframe : 50 days
Technical
A technical analysis in 15 min. of this MICRO E-MINI NASDAQ100 ONLY0325 chart shows a strongly bullish trend. 92.86% of the signals given by moving averages are bullish. This strongly bullish trend is supported by the strong bullish signals given by short-term moving averages. The Central Indicators market scanner is currently detecting a bullish signal that could impact this trend:
Moving Average bullish crossovers : MA20 & MA50
Type : Bullish
Timeframe : 15 minutes
In fact, 14 technical indicators on 18 studied are currently bullish. Caution: the Central Indicators scanner currently detects an excess:
CCI indicator is overbought : over 100
Type : Neutral
Timeframe : 15 minutes
Williams %R indicator is overbought : over -20
Type : Neutral
Timeframe : 15 minutes
Price is back over the pivot point
Type : Bullish
Timeframe : Weekly
Momentum indicator is back over 0
Type : Bullish
Timeframe : 15 minutes
No signals are given by Central Patterns, a market scanner specialised in chart patterns, resistances and supports.
No result was found by the Central Candlesticks scanner on Japanese candlesticks.
| S3 | S2 | S1 | Price | R1 | R2 | |
|---|---|---|---|---|---|---|
| ProTrendLines | 21,395.00 | 21,695.21 | 21,807.25 | 21,816.00 | 22,039.85 | 22,408.00 |
| Change (%) | -1.93% | -0.55% | -0.04% | - | +1.03% | +2.71% |
| Change | -421.00 | -120.79 | -8.75 | - | +223.85 | +592.00 |
| Level | Major | Intermediate | Minor | - | Major | Intermediate |
Pivot points can also be used to set your price objectives. Here is the price situation in relation to pivot points:
| Pivot points | S3 | S2 | S1 | PP | R1 | R2 | R3 |
|---|---|---|---|---|---|---|---|
| Standard | 21,163.00 | 21,296.00 | 21,529.50 | 21,662.50 | 21,896.00 | 22,029.00 | 22,262.50 |
| Camarilla | 21,662.21 | 21,695.81 | 21,729.40 | 21,763.00 | 21,796.60 | 21,830.19 | 21,863.79 |
| Woodie | 21,213.25 | 21,321.13 | 21,579.75 | 21,687.63 | 21,946.25 | 22,054.13 | 22,312.75 |
| Fibonacci | 21,296.00 | 21,436.00 | 21,522.50 | 21,662.50 | 21,802.50 | 21,889.00 | 22,029.00 |
| Pivot points | S3 | S2 | S1 | PP | R1 | R2 | R3 |
|---|---|---|---|---|---|---|---|
| Standard | 19,711.42 | 20,237.58 | 20,913.42 | 21,439.58 | 22,115.42 | 22,641.58 | 23,317.42 |
| Camarilla | 21,258.70 | 21,368.88 | 21,479.07 | 21,589.25 | 21,699.43 | 21,809.62 | 21,919.80 |
| Woodie | 19,786.25 | 20,275.00 | 20,988.25 | 21,477.00 | 22,190.25 | 22,679.00 | 23,392.25 |
| Fibonacci | 20,237.58 | 20,696.75 | 20,980.42 | 21,439.58 | 21,898.75 | 22,182.42 | 22,641.58 |
| Pivot points | S3 | S2 | S1 | PP | R1 | R2 | R3 |
|---|---|---|---|---|---|---|---|
| Standard | 19,423.33 | 20,058.42 | 20,823.83 | 21,458.92 | 22,224.33 | 22,859.42 | 23,624.83 |
| Camarilla | 21,204.11 | 21,332.49 | 21,460.87 | 21,589.25 | 21,717.63 | 21,846.01 | 21,974.39 |
| Woodie | 19,488.50 | 20,091.00 | 20,889.00 | 21,491.50 | 22,289.50 | 22,892.00 | 23,690.00 |
| Fibonacci | 20,058.42 | 20,593.41 | 20,923.93 | 21,458.92 | 21,993.91 | 22,324.43 | 22,859.42 |
Numerical data
The following is the status of technical indicators and moving averages registered at the time this technical analysis was created:
| RSI (14): | 60.25 | |
| MACD (12,26,9): | 8.5200 | |
| Directional Movement: | 6.49 | |
| AROON (14): | -14.28 | |
| DEMA (21): | 21,800.18 | |
| Parabolic SAR (0,02-0,02-0,2): | 21,745.69 | |
| Elder Ray (13): | 22.99 | |
| Super Trend (3,10): | 21,709.27 | |
| Zig ZAG (10): | 21,826.75 | |
| VORTEX (21): | 1.0600 | |
| Stochastique (14,3,5): | 73.05 | |
| TEMA (21): | 21,809.54 | |
| Williams %R (14): | -18.31 | |
| Chande Momentum Oscillator (20): | 37.25 | |
| Repulse (5,40,3): | 0.1900 | |
| ROCnROLL: | 1 | |
| TRIX (15,9): | 0.0000 | |
| Courbe Coppock: | 0.19 |
| MA7: | 21,630.71 | |
| MA20: | 21,535.61 | |
| MA50: | 21,617.88 | |
| MA100: | 21,172.32 | |
| MAexp7: | 21,814.02 | |
| MAexp20: | 21,791.31 | |
| MAexp50: | 21,780.96 | |
| MAexp100: | 21,747.43 | |
| Price / MA7: | +0.86% | |
| Price / MA20: | +1.30% | |
| Price / MA50: | +0.92% | |
| Price / MA100: | +3.04% | |
| Price / MAexp7: | +0.01% | |
| Price / MAexp20: | +0.12% | |
| Price / MAexp50: | +0.16% | |
| Price / MAexp100: | +0.32% |
About author

Online


Add a comment
Comments
0 comments on the analysis MICRO E-MINI NASDAQ100 ONLY0325 - 15 min.