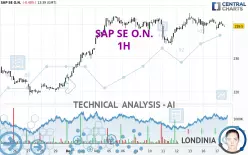
SAP SE O.N. - 1H - Technical analysis published on 12/17/2024 (GMT)
- 103
- 0
Click here for a new analysis!
- Timeframe : 1H
- - Analysis generated on
- Status : LEVEL MAINTAINED

Summary of the analysis

Additional analysis
Quotes
The SAP SE O.N. rating is 239.50 EUR. The price registered a decrease of -0.48% on the session and was between 238.40 EUR and 241.05 EUR. This implies that the price is at +0.46% from its lowest and at -0.64% from its highest.Here is a more detailed summary of the historical variations registered by SAP SE O.N.:
Near a new HIGH record (5 years)
Type : Bullish
Timeframe : Weekly
Near a new HIGH record (1 year)
Type : Bullish
Timeframe : Weekly
Near a new HIGH record (1st january)
Type : Bullish
Timeframe : Weekly
Near a new HIGH record (1 month)
Type : Bullish
Timeframe : Weekly
Technical
A technical analysis in 1H of this SAP SE O.N. chart shows a neutral trend. This indecision could turn into a bearish trend due to the strong bearish signals currently being given by short-term moving averages. An assessment of moving averages reveals a bearish signal that could impact this trend:
Bearish trend reversal : Moving Average 50
Type : Bearish
Timeframe : 1 hour
In fact, 10 technical indicators on 18 studied are currently bearish. No additional result has been identified by Central Indicators, the scanner specialised in technical indicators.
No signals are given by Central Patterns, a market scanner specialised in chart patterns, resistances and supports.
There is also a Japanese candlestick pattern detected by Central Candlesticks that could mark the end of the current short-term trend:
Doji
Type : Neutral
Timeframe : 1 hour
| S3 | S2 | S1 | Price | R1 | |
|---|---|---|---|---|---|
| ProTrendLines | 227.65 | 233.90 | 238.75 | 239.50 | 242.00 |
| Change (%) | -4.95% | -2.34% | -0.31% | - | +1.04% |
| Change | -11.85 | -5.60 | -0.75 | - | +2.50 |
| Level | Intermediate | Minor | Minor | - | Major |
Pivot points can also be used to set your price objectives. Here is the price situation in relation to pivot points:
| Pivot points | S3 | S2 | S1 | PP | R1 | R2 | R3 |
|---|---|---|---|---|---|---|---|
| Standard | 233.45 | 235.35 | 238.00 | 239.90 | 242.55 | 244.45 | 247.10 |
| Camarilla | 239.40 | 239.82 | 240.23 | 240.65 | 241.07 | 241.48 | 241.90 |
| Woodie | 233.83 | 235.54 | 238.38 | 240.09 | 242.93 | 244.64 | 247.48 |
| Fibonacci | 235.35 | 237.09 | 238.16 | 239.90 | 241.64 | 242.71 | 244.45 |
| Pivot points | S3 | S2 | S1 | PP | R1 | R2 | R3 |
|---|---|---|---|---|---|---|---|
| Standard | 226.00 | 229.95 | 235.50 | 239.45 | 245.00 | 248.95 | 254.50 |
| Camarilla | 238.44 | 239.31 | 240.18 | 241.05 | 241.92 | 242.79 | 243.66 |
| Woodie | 226.80 | 230.35 | 236.30 | 239.85 | 245.80 | 249.35 | 255.30 |
| Fibonacci | 229.95 | 233.58 | 235.82 | 239.45 | 243.08 | 245.32 | 248.95 |
| Pivot points | S3 | S2 | S1 | PP | R1 | R2 | R3 |
|---|---|---|---|---|---|---|---|
| Standard | 200.67 | 206.63 | 215.77 | 221.73 | 230.87 | 236.83 | 245.97 |
| Camarilla | 220.75 | 222.13 | 223.52 | 224.90 | 226.28 | 227.67 | 229.05 |
| Woodie | 202.25 | 207.43 | 217.35 | 222.53 | 232.45 | 237.63 | 247.55 |
| Fibonacci | 206.63 | 212.40 | 215.97 | 221.73 | 227.50 | 231.07 | 236.83 |
Numerical data
The following is the status of the technical indicators and moving averages at the time of publication of this technical analysis:
| RSI (14): | 45.88 | |
| MACD (12,26,9): | -0.0300 | |
| Directional Movement: | -8.98 | |
| AROON (14): | 42.86 | |
| DEMA (21): | 240.27 | |
| Parabolic SAR (0,02-0,02-0,2): | 241.05 | |
| Elder Ray (13): | -0.69 | |
| Super Trend (3,10): | 238.26 | |
| Zig ZAG (10): | 239.45 | |
| VORTEX (21): | 0.9500 | |
| Stochastique (14,3,5): | 49.49 | |
| TEMA (21): | 239.96 | |
| Williams %R (14): | -69.12 | |
| Chande Momentum Oscillator (20): | -1.05 | |
| Repulse (5,40,3): | -0.2900 | |
| ROCnROLL: | -1 | |
| TRIX (15,9): | 0.0100 | |
| Courbe Coppock: | 0.53 |
| MA7: | 240.26 | |
| MA20: | 232.75 | |
| MA50: | 222.78 | |
| MA100: | 209.83 | |
| MAexp7: | 239.96 | |
| MAexp20: | 240.21 | |
| MAexp50: | 239.63 | |
| MAexp100: | 237.18 | |
| Price / MA7: | -0.32% | |
| Price / MA20: | +2.90% | |
| Price / MA50: | +7.51% | |
| Price / MA100: | +14.14% | |
| Price / MAexp7: | -0.19% | |
| Price / MAexp20: | -0.30% | |
| Price / MAexp50: | -0.05% | |
| Price / MAexp100: | +0.98% |
News
Don't forget to follow the news on SAP SE O.N.. At the time of publication of this analysis, the latest news was as follows:
- Fujitsu drives business process improvement at Mitsubishi Electric Engineering using SAP Signavio(R)
- Panaya and Tritusa Join Forces to Enhance SAP Testing in Australia
- Coveo expands partnership with SAP to deliver AI capabilities across CX channels from Commerce to Customer Service
- Fujitsu and SAP Fioneer enter partnership to accelerate digital transformation in the insurance industry and deliver services that contribute to customers' sustainable business
- REPLY: Reply Recognized in SAP Services Landscape Report
About author
Online


Add a comment
Comments
0 comments on the analysis SAP SE O.N. - 1H