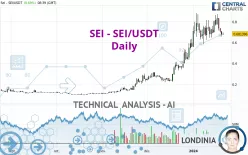
SEI - SEI/USDT - Daily - Technical analysis published on 01/21/2024 (GMT)
- 1401
- 0
Click here for a new analysis!
- Timeframe : Daily
- - Analysis generated on
- Status : INVALID

Summary of the analysis

Additional analysis
Quotes
The SEI - SEI/USDT rating is 0.681396 USDT. The price registered an increase of +0.69% on the session with the lowest point at 0.673136 USDT and the highest point at 0.695510 USDT. The deviation from the price is +1.23% for the low point and -2.03% for the high point.The Central Gaps scanner detects a bearish opening. A small advantage for sellers in the very short term.
Bearish opening
Type : Bearish
Timeframe : Openning
Here is a more detailed summary of the historical variations registered by SEI - SEI/USDT:
Abnormal volumes
Timeframe : 20 days
Abnormal volumes
Timeframe : 50 days
Technical
Technical analysis of this Daily chart of SEI - SEI/USDT indicates that the overall trend is bullish. 71.43% of the signals given by moving averages are bullish. Caution: the neutral signals currently given by short-term moving averages show us that the global trend is losing momentum. An assessment of moving averages reveals several bearish signals that could impact this trend:
Bearish trend reversal : adaptative moving average 20
Type : Bearish
Timeframe : Daily
Bearish price crossover with Moving Average 20
Type : Bearish
Timeframe : Daily
In fact, of the 18 technical indicators analysed by Central Analyzer, 5 are bullish, 8 are neutral and 5 are bearish. Central Indicators, the detector scanner for these technical indicators has recently detected several signals:
Price is back under the pivot point
Type : Bearish
Timeframe : Weekly
Momentum indicator is back over 0
Type : Bullish
Timeframe : Daily
Williams %R indicator is back under -50
Type : Bearish
Timeframe : Daily
No signals are given by Central Patterns, a market scanner specialised in chart patterns, resistances and supports.
The Central Candlesticks scanner, specialised in Japanese candlesticks, did not identify any signals.
| S3 | S2 | S1 | Price | R1 | |
|---|---|---|---|---|---|
| ProTrendLines | 0.233240 | 0.309292 | 0.650769 | 0.681396 | 0.783084 |
| Change (%) | -65.77% | -54.61% | -4.49% | - | +14.92% |
| Change | -0.448156 | -0.372104 | -0.030627 | - | +0.101688 |
| Level | Intermediate | Minor | Intermediate | - | Intermediate |
To determine price objectives, it is also possible to use the pivot points. Here is the price position in relation to pivot points:
| Pivot points | S3 | S2 | S1 | PP | R1 | R2 | R3 |
|---|---|---|---|---|---|---|---|
| Standard | 0.603722 | 0.630365 | 0.653554 | 0.680197 | 0.703386 | 0.730029 | 0.753218 |
| Camarilla | 0.663038 | 0.667606 | 0.672174 | 0.676742 | 0.681310 | 0.685878 | 0.690446 |
| Woodie | 0.601994 | 0.629502 | 0.651826 | 0.679334 | 0.701658 | 0.729166 | 0.751490 |
| Fibonacci | 0.630365 | 0.649401 | 0.661162 | 0.680197 | 0.699233 | 0.710994 | 0.730029 |
| Pivot points | S3 | S2 | S1 | PP | R1 | R2 | R3 |
|---|---|---|---|---|---|---|---|
| Standard | 0.381392 | 0.519201 | 0.597971 | 0.735780 | 0.814550 | 0.952359 | 1.031129 |
| Camarilla | 0.617183 | 0.637036 | 0.656889 | 0.676742 | 0.696595 | 0.716448 | 0.736301 |
| Woodie | 0.351874 | 0.504441 | 0.568453 | 0.721020 | 0.785032 | 0.937599 | 1.001611 |
| Fibonacci | 0.519201 | 0.601934 | 0.653047 | 0.735780 | 0.818513 | 0.869626 | 0.952359 |
| Pivot points | S3 | S2 | S1 | PP | R1 | R2 | R3 |
|---|---|---|---|---|---|---|---|
| Standard | -0.107599 | 0.056010 | 0.308050 | 0.471659 | 0.723699 | 0.887308 | 1.139348 |
| Camarilla | 0.445788 | 0.483889 | 0.521990 | 0.560091 | 0.598192 | 0.636293 | 0.674395 |
| Woodie | -0.063383 | 0.078118 | 0.352267 | 0.493767 | 0.767916 | 0.909416 | 1.183565 |
| Fibonacci | 0.056010 | 0.214788 | 0.312881 | 0.471659 | 0.630437 | 0.728530 | 0.887308 |
Numerical data
The following are the details of the technical indicators and moving averages that were collected to generate this technical analysis:
| RSI (14): | 52.37 | |
| MACD (12,26,9): | 0.0583 | |
| Directional Movement: | 3.971131 | |
| AROON (14): | 64.285714 | |
| DEMA (21): | 0.776774 | |
| Parabolic SAR (0,02-0,02-0,2): | 0.657009 | |
| Elder Ray (13): | -0.028283 | |
| Super Trend (3,10): | 0.504563 | |
| Zig ZAG (10): | 0.680250 | |
| VORTEX (21): | 1.0480 | |
| Stochastique (14,3,5): | 36.09 | |
| TEMA (21): | 0.753736 | |
| Williams %R (14): | -66.55 | |
| Chande Momentum Oscillator (20): | 0.004850 | |
| Repulse (5,40,3): | -8.6294 | |
| ROCnROLL: | -1 | |
| TRIX (15,9): | 2.1380 | |
| Courbe Coppock: | 7.12 |
| MA7: | 0.743866 | |
| MA20: | 0.725945 | |
| MA50: | 0.502746 | |
| MA100: | 0.324674 | |
| MAexp7: | 0.715509 | |
| MAexp20: | 0.685992 | |
| MAexp50: | 0.545297 | |
| MAexp100: | 0.405329 | |
| Price / MA7: | -8.40% | |
| Price / MA20: | -6.14% | |
| Price / MA50: | +35.53% | |
| Price / MA100: | +109.87% | |
| Price / MAexp7: | -4.77% | |
| Price / MAexp20: | -0.67% | |
| Price / MAexp50: | +24.96% | |
| Price / MAexp100: | +68.11% |
About author

Online


Add a comment
Comments
0 comments on the analysis SEI - SEI/USDT - Daily