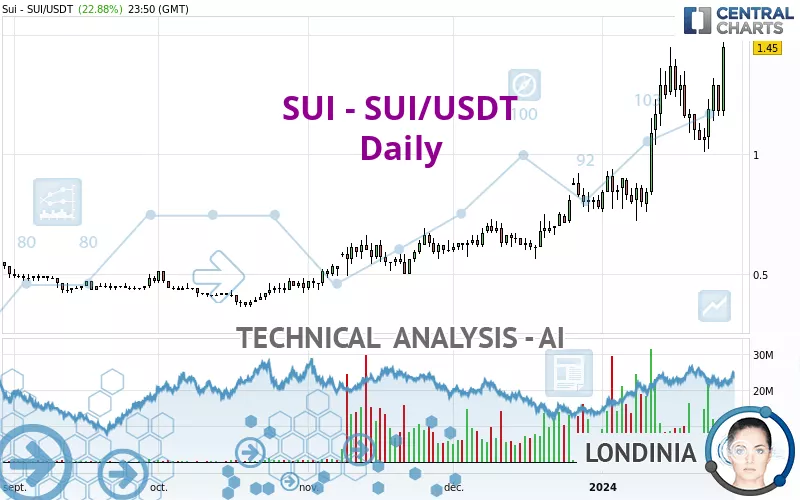
SUI - SUI/USDT - Daily - Technical analysis published on 01/26/2024 (GMT)
- 211
- 0
- Timeframe : Daily
- - Analysis generated on
- Status : WITHOUT TARGET

Summary of the analysis

Additional analysis
Quotes
SUI - SUI/USDT rating 1.45 USDT. The price has increased by +22.88% since the last closing with the lowest point at 1.16 USDT and the highest point at 1.47 USDT. The deviation from the price is +25.00% for the low point and -1.36% for the high point.So that you have an overall view of the price change, here is a table showing the variations over several periods:
New HIGH record (5 years)
Type : Bullish
Timeframe : Weekly
New HIGH record (1 year)
Type : Bullish
Timeframe : Weekly
New HIGH record (1st january)
Type : Bullish
Timeframe : Weekly
New HIGH record (1 month)
Type : Bullish
Timeframe : Weekly
The Central Volumes scanner detects abnormal volumes on the asset:
Abnormal volumes
Timeframe : 5 days
Abnormal volumes
Timeframe : 20 days
Abnormal volumes
Timeframe : 50 days
Technical
A technical analysis in Daily of this SUI - SUI/USDT chart shows a strongly bullish trend. The signals given by the moving averages are 92.86% bullish. This strong bullish trend is confirmed by the strong signals currently being given by short-term moving averages. The Central Indicators market scanner currently does not detect any result that concerns moving averages.
An assessment of technical indicators shows a strong bullish signal.
But beware of excesses. The Central Indicators scanner currently detects this:
CCI indicator is overbought : over 100
Type : Neutral
Timeframe : Daily
Williams %R indicator is overbought : over -20
Type : Neutral
Timeframe : Daily
Pivot points : price is over resistance 1
Type : Neutral
Timeframe : Weekly
Pivot points : price is over resistance 3
Type : Neutral
Timeframe : Daily
MACD crosses UP its Moving Average
Type : Bullish
Timeframe : Daily
Parabolic SAR indicator bullish reversal
Type : Bullish
Timeframe : Daily
Momentum indicator is back over 0
Type : Bullish
Timeframe : Daily
The analysis of the price chart with Central Patterns scanners does not return any result.
No result was found by the Central Candlesticks scanner on Japanese candlesticks.
| S3 | S2 | S1 | Price | |
|---|---|---|---|---|
| ProTrendLines | 0.80 | 0.91 | 1.37 | 1.45 |
| Change (%) | -44.83% | -37.24% | -5.52% | - |
| Change | -0.65 | -0.54 | -0.08 | - |
| Level | Intermediate | Minor | Major | - |
To determine price objectives, it is also possible to use the pivot points. Here is the price position in relation to pivot points:
| Pivot points | S3 | S2 | S1 | PP | R1 | R2 | R3 |
|---|---|---|---|---|---|---|---|
| Standard | 1.00 | 1.08 | 1.13 | 1.21 | 1.26 | 1.34 | 1.39 |
| Camarilla | 1.14 | 1.16 | 1.17 | 1.18 | 1.19 | 1.20 | 1.22 |
| Woodie | 0.99 | 1.07 | 1.12 | 1.20 | 1.25 | 1.33 | 1.38 |
| Fibonacci | 1.08 | 1.13 | 1.16 | 1.21 | 1.26 | 1.29 | 1.34 |
| Pivot points | S3 | S2 | S1 | PP | R1 | R2 | R3 |
|---|---|---|---|---|---|---|---|
| Standard | 0.57 | 0.81 | 0.96 | 1.20 | 1.35 | 1.59 | 1.74 |
| Camarilla | 0.99 | 1.03 | 1.06 | 1.10 | 1.14 | 1.17 | 1.21 |
| Woodie | 0.52 | 0.79 | 0.91 | 1.18 | 1.30 | 1.57 | 1.69 |
| Fibonacci | 0.81 | 0.96 | 1.05 | 1.20 | 1.35 | 1.44 | 1.59 |
| Pivot points | S3 | S2 | S1 | PP | R1 | R2 | R3 |
|---|---|---|---|---|---|---|---|
| Standard | 0.23 | 0.39 | 0.59 | 0.75 | 0.95 | 1.11 | 1.31 |
| Camarilla | 0.68 | 0.71 | 0.75 | 0.78 | 0.81 | 0.85 | 0.88 |
| Woodie | 0.24 | 0.40 | 0.60 | 0.76 | 0.96 | 1.12 | 1.32 |
| Fibonacci | 0.39 | 0.53 | 0.62 | 0.75 | 0.89 | 0.98 | 1.11 |
Numerical data
The following is the status of the technical indicators and moving averages at the time of publication of this technical analysis:
| RSI (14): | 66.36 | |
| MACD (12,26,9): | 0.1100 | |
| Directional Movement: | 19.57 | |
| AROON (14): | 28.57 | |
| DEMA (21): | 1.28 | |
| Parabolic SAR (0,02-0,02-0,2): | 1.01 | |
| Elder Ray (13): | 0.13 | |
| Super Trend (3,10): | 0.93 | |
| Zig ZAG (10): | 1.45 | |
| VORTEX (21): | 1.1200 | |
| Stochastique (14,3,5): | 68.90 | |
| TEMA (21): | 1.30 | |
| Williams %R (14): | -5.91 | |
| Chande Momentum Oscillator (20): | 0.19 | |
| Repulse (5,40,3): | 24.0800 | |
| ROCnROLL: | 1 | |
| TRIX (15,9): | 1.6500 | |
| Courbe Coppock: | 41.45 |
| MA7: | 1.19 | |
| MA20: | 1.13 | |
| MA50: | 0.90 | |
| MA100: | 0.72 | |
| MAexp7: | 1.25 | |
| MAexp20: | 1.14 | |
| MAexp50: | 0.96 | |
| MAexp100: | 0.81 | |
| Price / MA7: | +21.85% | |
| Price / MA20: | +28.32% | |
| Price / MA50: | +61.11% | |
| Price / MA100: | +101.39% | |
| Price / MAexp7: | +16.00% | |
| Price / MAexp20: | +27.19% | |
| Price / MAexp50: | +51.04% | |
| Price / MAexp100: | +79.01% |
About author

Online


Add a comment
Comments
0 comments on the analysis SUI - SUI/USDT - Daily