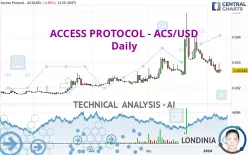
ACCESS PROTOCOL - ACS/USD - Daily - Technical analysis published on 01/08/2024 (GMT)
- 153
- 0
- Timeframe : Daily
- - Analysis generated on
- Status : NEUTRAL

Summary of the analysis

Additional analysis
Quotes
The ACCESS PROTOCOL - ACS/USD rating is 0.002683 USD. The price registered a decrease of -0.85% on the session with the lowest point at 0.002600 USD and the highest point at 0.002715 USD. The deviation from the price is +3.19% for the low point and -1.18% for the high point.So that you have an overall view of the price change, here is a table showing the variations over several periods:
Near a new LOW record (1st january)
Type : Bearish
Timeframe : Weekly
Near a new LOW record (1 month)
Type : Bearish
Timeframe : Weekly
The Central Volumes scanner notes the presence of abnormal volumes:
Abnormal volumes
Timeframe : 5 days
Abnormal volumes
Timeframe : 20 days
Abnormal volumes
Timeframe : 50 days
Technical
A technical analysis in Daily of this ACCESS PROTOCOL - ACS/USD chart shows a slightly bullish trend. 60.71% of the signals given by moving averages are bullish. Caution: the slightly bearish signals currently given by short-term moving averages indicate that the overall trend could be reversed. The Central Indicators scanner detects a bullish signal on moving averages that could impact this trend:
Bullish trend reversal : Moving Average 20
Type : Bullish
Timeframe : Daily
The probability of a further decline is moderate given the direction of the technical indicators.
Caution: the Central Indicators scanner currently detects an excess:
CCI indicator is oversold : under -100
Type : Neutral
Timeframe : Daily
Williams %R indicator is oversold : under -80
Type : Neutral
Timeframe : Daily
The analysis of the price chart with Central Patterns scanners does not return any result.
The Central Candlesticks scanner which studies Japanese candlesticks did not detect anything.
| S3 | S2 | S1 | Price | R1 | R2 | R3 | |
|---|---|---|---|---|---|---|---|
| ProTrendLines | 0.001747 | 0.002169 | 0.002524 | 0.002683 | 0.003140 | 0.003518 | 0.003976 |
| Change (%) | -34.89% | -19.16% | -5.93% | - | +17.03% | +31.12% | +48.19% |
| Change | -0.000936 | -0.000514 | -0.000159 | - | +0.000457 | +0.000835 | +0.001293 |
| Level | Minor | Minor | Intermediate | - | Intermediate | Minor | Major |
Pivot points can also be used to set your price objectives. Here is the price situation in relation to pivot points:
| Pivot points | S3 | S2 | S1 | PP | R1 | R2 | R3 |
|---|---|---|---|---|---|---|---|
| Standard | 0.002192 | 0.002397 | 0.002551 | 0.002756 | 0.002910 | 0.003115 | 0.003269 |
| Camarilla | 0.002607 | 0.002640 | 0.002673 | 0.002706 | 0.002739 | 0.002772 | 0.002805 |
| Woodie | 0.002168 | 0.002384 | 0.002527 | 0.002743 | 0.002886 | 0.003102 | 0.003245 |
| Fibonacci | 0.002397 | 0.002534 | 0.002619 | 0.002756 | 0.002893 | 0.002978 | 0.003115 |
| Pivot points | S3 | S2 | S1 | PP | R1 | R2 | R3 |
|---|---|---|---|---|---|---|---|
| Standard | 0.001716 | 0.002149 | 0.002377 | 0.002810 | 0.003038 | 0.003471 | 0.003699 |
| Camarilla | 0.002423 | 0.002484 | 0.002544 | 0.002605 | 0.002666 | 0.002726 | 0.002787 |
| Woodie | 0.001614 | 0.002098 | 0.002275 | 0.002759 | 0.002936 | 0.003420 | 0.003597 |
| Fibonacci | 0.002149 | 0.002402 | 0.002558 | 0.002810 | 0.003063 | 0.003219 | 0.003471 |
| Pivot points | S3 | S2 | S1 | PP | R1 | R2 | R3 |
|---|---|---|---|---|---|---|---|
| Standard | -0.000692 | 0.000818 | 0.001929 | 0.003439 | 0.004550 | 0.006060 | 0.007171 |
| Camarilla | 0.002318 | 0.002559 | 0.002799 | 0.003039 | 0.003279 | 0.003520 | 0.003760 |
| Woodie | -0.000893 | 0.000718 | 0.001729 | 0.003339 | 0.004350 | 0.005960 | 0.006971 |
| Fibonacci | 0.000818 | 0.001820 | 0.002438 | 0.003439 | 0.004441 | 0.005059 | 0.006060 |
Numerical data
The following is the status of technical indicators and moving averages registered at the time this technical analysis was created:
| RSI (14): | 42.67 | |
| MACD (12,26,9): | 0.0000 | |
| Directional Movement: | 16.314361 | |
| AROON (14): | -78.571429 | |
| DEMA (21): | 0.002935 | |
| Parabolic SAR (0,02-0,02-0,2): | 0.003712 | |
| Elder Ray (13): | -0.000240 | |
| Super Trend (3,10): | 0.003465 | |
| Zig ZAG (10): | 0.002684 | |
| VORTEX (21): | 1.0034 | |
| Stochastique (14,3,5): | 5.36 | |
| TEMA (21): | 0.002762 | |
| Williams %R (14): | -93.61 | |
| Chande Momentum Oscillator (20): | -0.000801 | |
| Repulse (5,40,3): | -6.8741 | |
| ROCnROLL: | 2 | |
| TRIX (15,9): | 0.2958 | |
| Courbe Coppock: | 30.84 |
| MA7: | 0.002797 | |
| MA20: | 0.003157 | |
| MA50: | 0.002778 | |
| MA100: | 0.002411 | |
| MAexp7: | 0.002789 | |
| MAexp20: | 0.002934 | |
| MAexp50: | 0.002789 | |
| MAexp100: | 0.002438 | |
| Price / MA7: | -4.08% | |
| Price / MA20: | -15.01% | |
| Price / MA50: | -3.42% | |
| Price / MA100: | +11.28% | |
| Price / MAexp7: | -3.80% | |
| Price / MAexp20: | -8.55% | |
| Price / MAexp50: | -3.80% | |
| Price / MAexp100: | +10.05% |
About author

Online


Add a comment
Comments
0 comments on the analysis ACCESS PROTOCOL - ACS/USD - Daily