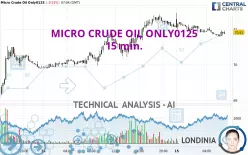
MICRO CRUDE OIL ONLY0125 - 15 min. - Technical analysis published on 12/16/2024 (GMT)
- 103
- 0
- Timeframe : 15 min.
- - Analysis generated on
- Status : NEUTRAL

Summary of the analysis
Additional analysis
Quotes
The MICRO CRUDE OIL ONLY0125 price is 70.91 USD. On the day, this instrument lost -0.53% and was between 70.79 USD and 71.45 USD. This implies that the price is at +0.17% from its lowest and at -0.76% from its highest.The Central Gaps scanner detects a bearish opening. A small advantage for sellers in the very short term.
Bearish opening
Type : Bearish
Timeframe : Openning
Here is a more detailed summary of the historical variations registered by MICRO CRUDE OIL ONLY0125:
Near a new HIGH record (1 month)
Type : Bullish
Timeframe : Weekly
The Central Volumes scanner notes the presence of abnormal volumes:
Abnormal volumes
Timeframe : 5 days
Abnormal volumes
Timeframe : 20 days
Abnormal volumes
Timeframe : 50 days
Technical
Technical analysis of MICRO CRUDE OIL ONLY0125 in 15 min. shows a neutral overall trend. The slightly bearish signals currently given by short-term moving averages could allow the overall trend to return to a slightly bearish trend. An assessment of moving averages reveals a bearish signal that could impact this trend:
Bearish price crossover with Moving Average 20
Type : Bearish
Timeframe : 15 minutes
An assessment of technical indicators does not currently provide any relevant information to suggest whether the signal given by the technical indicators is more bullish or bearish.
Central Indicators, the scanner specialised in technical indicators, has identified this signal:
MACD crosses UP its Moving Average
Type : Bullish
Timeframe : 15 minutes
No signals are given by Central Patterns, a market scanner specialised in chart patterns, resistances and supports.
No result was found by the Central Candlesticks scanner on Japanese candlesticks.
| S3 | S2 | S1 | Price | R1 | R2 | R3 | |
|---|---|---|---|---|---|---|---|
| ProTrendLines | 69.15 | 69.94 | 70.52 | 70.91 | 71.26 | 75.87 | 78.66 |
| Change (%) | -2.48% | -1.37% | -0.55% | - | +0.49% | +6.99% | +10.93% |
| Change | -1.76 | -0.97 | -0.39 | - | +0.35 | +4.96 | +7.75 |
| Level | Intermediate | Minor | Intermediate | - | Major | Major | Minor |
Pivot points can also be used to set your price objectives. Here is the price situation in relation to pivot points:
| Pivot points | S3 | S2 | S1 | PP | R1 | R2 | R3 |
|---|---|---|---|---|---|---|---|
| Standard | 68.78 | 69.33 | 70.31 | 70.86 | 71.84 | 72.39 | 73.37 |
| Camarilla | 70.87 | 71.01 | 71.15 | 71.29 | 71.43 | 71.57 | 71.71 |
| Woodie | 69.00 | 69.44 | 70.53 | 70.97 | 72.06 | 72.50 | 73.59 |
| Fibonacci | 69.33 | 69.91 | 70.28 | 70.86 | 71.44 | 71.81 | 72.39 |
| Pivot points | S3 | S2 | S1 | PP | R1 | R2 | R3 |
|---|---|---|---|---|---|---|---|
| Standard | 64.05 | 65.54 | 68.42 | 69.91 | 72.79 | 74.28 | 77.16 |
| Camarilla | 70.09 | 70.49 | 70.89 | 71.29 | 71.69 | 72.09 | 72.49 |
| Woodie | 64.74 | 65.89 | 69.11 | 70.26 | 73.48 | 74.63 | 77.85 |
| Fibonacci | 65.54 | 67.21 | 68.24 | 69.91 | 71.58 | 72.61 | 74.28 |
| Pivot points | S3 | S2 | S1 | PP | R1 | R2 | R3 |
|---|---|---|---|---|---|---|---|
| Standard | 59.25 | 62.76 | 65.38 | 68.89 | 71.51 | 75.02 | 77.64 |
| Camarilla | 66.31 | 66.88 | 67.44 | 68.00 | 68.56 | 69.12 | 69.69 |
| Woodie | 58.81 | 62.54 | 64.94 | 68.67 | 71.07 | 74.80 | 77.20 |
| Fibonacci | 62.76 | 65.10 | 66.55 | 68.89 | 71.23 | 72.68 | 75.02 |
Numerical data
The following are the details of the technical indicators and moving averages that were collected to generate this technical analysis:
| RSI (14): | 33.96 | |
| MACD (12,26,9): | -0.0600 | |
| Directional Movement: | -5.79 | |
| AROON (14): | -64.29 | |
| DEMA (21): | 70.84 | |
| Parabolic SAR (0,02-0,02-0,2): | 70.88 | |
| Elder Ray (13): | -0.06 | |
| Super Trend (3,10): | 71.01 | |
| Zig ZAG (10): | 70.84 | |
| VORTEX (21): | 0.8900 | |
| Stochastique (14,3,5): | 15.01 | |
| TEMA (21): | 70.81 | |
| Williams %R (14): | -55.56 | |
| Chande Momentum Oscillator (20): | -0.07 | |
| Repulse (5,40,3): | 0.0900 | |
| ROCnROLL: | 1 | |
| TRIX (15,9): | -0.0100 | |
| Courbe Coppock: | 0.29 |
| MA7: | 69.53 | |
| MA20: | 69.20 | |
| MA50: | 69.69 | |
| MA100: | 70.19 | |
| MAexp7: | 70.88 | |
| MAexp20: | 70.91 | |
| MAexp50: | 70.92 | |
| MAexp100: | 70.78 | |
| Price / MA7: | +1.98% | |
| Price / MA20: | +2.47% | |
| Price / MA50: | +1.75% | |
| Price / MA100: | +1.03% | |
| Price / MAexp7: | +0.04% | |
| Price / MAexp20: | -0% | |
| Price / MAexp50: | -0.01% | |
| Price / MAexp100: | +0.18% |
About author

Online


Add a comment
Comments
0 comments on the analysis MICRO CRUDE OIL ONLY0125 - 15 min.