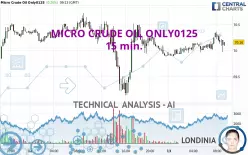
MICRO CRUDE OIL ONLY0125 - 15 min. - Technical analysis published on 12/13/2024 (GMT)
- 111
- 0
- Timeframe : 15 min.
- - Analysis generated on
- Status : NEUTRAL

Summary of the analysis
Additional analysis
Quotes
MICRO CRUDE OIL ONLY0125 rating 70.16 USD. The price has increased by +0.20% since the last closing and was between 69.88 USD and 70.36 USD. This implies that the price is at +0.40% from its lowest and at -0.28% from its highest.A bearish opening was detected by the Central Gaps scanner. Sellers are trying to impose a bearish trend in the very short term.
Bearish opening
Type : Bearish
Timeframe : Openning
So that you have an overall view of the price change, here is a table showing the variations over several periods:
Near a new LOW record (5 years)
Type : Bearish
Timeframe : Weekly
Near a new HIGH record (1 month)
Type : Bullish
Timeframe : Weekly
The Central Volumes scanner detects abnormal volumes on the asset:
Abnormal volumes
Timeframe : 5 days
Abnormal volumes
Timeframe : 20 days
Abnormal volumes
Timeframe : 50 days
Technical
A technical analysis in 15 min. of this MICRO CRUDE OIL ONLY0125 chart shows a neutral trend. This indecision could turn into a bullish trend due to the bullish signals currently being given by short-term moving averages. The Central Indicators market scanner is currently detecting several bearish and bullish signals that could impact this trend:
Bearish trend reversal : adaptative moving average 20
Type : Bearish
Timeframe : 15 minutes
Bullish price crossover with Moving Average 20
Type : Bullish
Timeframe : 15 minutes
Bullish price crossover with Moving Average 50
Type : Bullish
Timeframe : 15 minutes
Bearish price crossover with Moving Average 100
Type : Bearish
Timeframe : 15 minutes
The probability of a further decline is moderate given the direction of the technical indicators.
Other results related to technical indicators were also found by the Central Indicators scanner:
Pivot points : price is over resistance 1
Type : Neutral
Timeframe : Weekly
Williams %R indicator is back under -50
Type : Bearish
Timeframe : 15 minutes
Central Patterns, the scanner specializing in chart patterns, did not identify any signals.
The presence of a bullish Japanese candlestick pattern detected by Central Candlesticks that could cause a very short term rebound was also detected:
Bullish harami
Type : Bullish
Timeframe : 15 minutes
| S3 | S2 | S1 | Price | R1 | R2 | R3 | |
|---|---|---|---|---|---|---|---|
| ProTrendLines | 68.39 | 69.15 | 69.94 | 70.16 | 70.22 | 70.52 | 71.26 |
| Change (%) | -2.52% | -1.44% | -0.31% | - | +0.09% | +0.51% | +1.57% |
| Change | -1.77 | -1.01 | -0.22 | - | +0.06 | +0.36 | +1.10 |
| Level | Minor | Minor | Minor | - | Minor | Major | Major |
Pivot points can also be used to set your price objectives. Here is the price situation in relation to pivot points:
| Pivot points | S3 | S2 | S1 | PP | R1 | R2 | R3 |
|---|---|---|---|---|---|---|---|
| Standard | 67.62 | 68.38 | 69.20 | 69.96 | 70.78 | 71.54 | 72.36 |
| Camarilla | 69.59 | 69.73 | 69.88 | 70.02 | 70.17 | 70.31 | 70.46 |
| Woodie | 67.65 | 68.40 | 69.23 | 69.98 | 70.81 | 71.56 | 72.39 |
| Fibonacci | 68.38 | 68.98 | 69.36 | 69.96 | 70.56 | 70.94 | 71.54 |
| Pivot points | S3 | S2 | S1 | PP | R1 | R2 | R3 |
|---|---|---|---|---|---|---|---|
| Standard | 62.44 | 64.71 | 65.96 | 68.23 | 69.48 | 71.75 | 73.00 |
| Camarilla | 66.23 | 66.56 | 66.88 | 67.20 | 67.52 | 67.85 | 68.17 |
| Woodie | 61.92 | 64.46 | 65.44 | 67.98 | 68.96 | 71.50 | 72.48 |
| Fibonacci | 64.71 | 66.06 | 66.89 | 68.23 | 69.58 | 70.41 | 71.75 |
| Pivot points | S3 | S2 | S1 | PP | R1 | R2 | R3 |
|---|---|---|---|---|---|---|---|
| Standard | 59.25 | 62.76 | 65.38 | 68.89 | 71.51 | 75.02 | 77.64 |
| Camarilla | 66.31 | 66.88 | 67.44 | 68.00 | 68.56 | 69.12 | 69.69 |
| Woodie | 58.81 | 62.54 | 64.94 | 68.67 | 71.07 | 74.80 | 77.20 |
| Fibonacci | 62.76 | 65.10 | 66.55 | 68.89 | 71.23 | 72.68 | 75.02 |
Numerical data
The following is the status of the technical indicators and moving averages at the time of publication of this technical analysis:
| RSI (14): | 44.86 | |
| MACD (12,26,9): | 0.0300 | |
| Directional Movement: | -5.54 | |
| AROON (14): | 64.29 | |
| DEMA (21): | 70.16 | |
| Parabolic SAR (0,02-0,02-0,2): | 70.35 | |
| Elder Ray (13): | -0.07 | |
| Super Trend (3,10): | 70.40 | |
| Zig ZAG (10): | 70.01 | |
| VORTEX (21): | 0.9200 | |
| Stochastique (14,3,5): | 21.14 | |
| TEMA (21): | 70.16 | |
| Williams %R (14): | -82.05 | |
| Chande Momentum Oscillator (20): | -0.04 | |
| Repulse (5,40,3): | -0.2100 | |
| ROCnROLL: | 2 | |
| TRIX (15,9): | 0.0100 | |
| Courbe Coppock: | 0.32 |
| MA7: | 68.98 | |
| MA20: | 69.06 | |
| MA50: | 69.76 | |
| MA100: | 70.20 | |
| MAexp7: | 70.14 | |
| MAexp20: | 70.13 | |
| MAexp50: | 70.09 | |
| MAexp100: | 70.05 | |
| Price / MA7: | +1.71% | |
| Price / MA20: | +1.59% | |
| Price / MA50: | +0.57% | |
| Price / MA100: | -0.06% | |
| Price / MAexp7: | +0.03% | |
| Price / MAexp20: | +0.04% | |
| Price / MAexp50: | +0.10% | |
| Price / MAexp100: | +0.16% |
About author

Online


Add a comment
Comments
0 comments on the analysis MICRO CRUDE OIL ONLY0125 - 15 min.