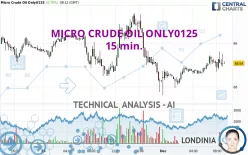
MICRO CRUDE OIL ONLY0125 - 15 min. - Technical analysis published on 12/02/2024 (GMT)
- 110
- 0
- Timeframe : 15 min.
- - Analysis generated on
- Status : NEUTRAL

Summary of the analysis
Additional analysis
Quotes
The MICRO CRUDE OIL ONLY0125 price is 68.54 USD. On the day, this instrument gained +0.79% and was between 67.81 USD and 68.81 USD. This implies that the price is at +1.08% from its lowest and at -0.39% from its highest.The Central Gaps scanner detects a bullish opening marking the presence of buyers ahead of sellers at the opening but not sufficiently marked to allow the price to register a quotation gap.
Bullish opening
Type : Bullish
Timeframe : Openning
So that you have an overall view of the price change, here is a table showing the variations over several periods:
Near a new LOW record (1 month)
Type : Bearish
Timeframe : Weekly
Abnormal volumes on MICRO CRUDE OIL ONLY0125 were detected by the Central Volumes scanner:
Abnormal volumes
Timeframe : 5 days
Abnormal volumes
Timeframe : 20 days
Abnormal volumes
Timeframe : 50 days
Technical
Technical analysis of this 15 min. chart of MICRO CRUDE OIL ONLY0125 indicates that the overall trend is slightly bearish. Only 50.00% of the signals given by moving averages are bearish. This slightly bearish trend could turn neutral or reverse given the slightly bullish signals currently being given by short-term moving averages. An assessment of moving averages reveals several bullish signals that could impact this trend:
Bullish price crossover with Moving Average 100
Type : Bullish
Timeframe : 15 minutes
Bullish price crossover with adaptative moving average 50
Type : Bullish
Timeframe : 15 minutes
In fact, 11 technical indicators on 18 studied are currently positioned bullish. The Central Indicators scanner found no further results concerning independent technical indicators.
The analysis of the price chart with Central Patterns scanners does not return any result.
The presence of a bullish Japanese candlestick pattern detected by Central Candlesticks that could cause a very short term rebound was also detected:
Bullish engulfing lines
Type : Bullish
Timeframe : 15 minutes
| S3 | S2 | S1 | Price | R1 | R2 | R3 | |
|---|---|---|---|---|---|---|---|
| ProTrendLines | 64.42 | 66.88 | 68.25 | 68.54 | 69.30 | 70.39 | 71.27 |
| Change (%) | -6.01% | -2.42% | -0.42% | - | +1.11% | +2.70% | +3.98% |
| Change | -4.12 | -1.66 | -0.29 | - | +0.76 | +1.85 | +2.73 |
| Level | Minor | Intermediate | Intermediate | - | Intermediate | Minor | Major |
Attention could also be paid to pivot points to set price objectives:
| Pivot points | S3 | S2 | S1 | PP | R1 | R2 | R3 |
|---|---|---|---|---|---|---|---|
| Standard | 65.55 | 66.71 | 67.36 | 68.52 | 69.17 | 70.33 | 70.98 |
| Camarilla | 67.50 | 67.67 | 67.83 | 68.00 | 68.17 | 68.33 | 68.50 |
| Woodie | 65.29 | 66.58 | 67.10 | 68.39 | 68.91 | 70.20 | 70.72 |
| Fibonacci | 66.71 | 67.41 | 67.83 | 68.52 | 69.22 | 69.64 | 70.33 |
| Pivot points | S3 | S2 | S1 | PP | R1 | R2 | R3 |
|---|---|---|---|---|---|---|---|
| Standard | 63.15 | 65.51 | 66.76 | 69.12 | 70.37 | 72.73 | 73.98 |
| Camarilla | 67.01 | 67.34 | 67.67 | 68.00 | 68.33 | 68.66 | 68.99 |
| Woodie | 62.59 | 65.23 | 66.20 | 68.84 | 69.81 | 72.45 | 73.42 |
| Fibonacci | 65.51 | 66.89 | 67.74 | 69.12 | 70.50 | 71.35 | 72.73 |
| Pivot points | S3 | S2 | S1 | PP | R1 | R2 | R3 |
|---|---|---|---|---|---|---|---|
| Standard | 59.25 | 62.76 | 65.38 | 68.89 | 71.51 | 75.02 | 77.64 |
| Camarilla | 66.31 | 66.88 | 67.44 | 68.00 | 68.56 | 69.12 | 69.69 |
| Woodie | 58.81 | 62.54 | 64.94 | 68.67 | 71.07 | 74.80 | 77.20 |
| Fibonacci | 62.76 | 65.10 | 66.55 | 68.89 | 71.23 | 72.68 | 75.02 |
Numerical data
The following is the status of technical indicators and moving averages registered at the time this technical analysis was created:
| RSI (14): | 56.83 | |
| MACD (12,26,9): | 0.0500 | |
| Directional Movement: | 14.21 | |
| AROON (14): | 85.71 | |
| DEMA (21): | 68.57 | |
| Parabolic SAR (0,02-0,02-0,2): | 68.37 | |
| Elder Ray (13): | 0.01 | |
| Super Trend (3,10): | 68.22 | |
| Zig ZAG (10): | 68.57 | |
| VORTEX (21): | 1.0300 | |
| Stochastique (14,3,5): | 54.65 | |
| TEMA (21): | 68.65 | |
| Williams %R (14): | -26.09 | |
| Chande Momentum Oscillator (20): | 0.23 | |
| Repulse (5,40,3): | 0.4600 | |
| ROCnROLL: | 1 | |
| TRIX (15,9): | 0.0100 | |
| Courbe Coppock: | 0.62 |
| MA7: | 69.02 | |
| MA20: | 69.24 | |
| MA50: | 69.85 | |
| MA100: | 70.78 | |
| MAexp7: | 68.57 | |
| MAexp20: | 68.50 | |
| MAexp50: | 68.50 | |
| MAexp100: | 68.60 | |
| Price / MA7: | -0.70% | |
| Price / MA20: | -1.01% | |
| Price / MA50: | -1.88% | |
| Price / MA100: | -3.16% | |
| Price / MAexp7: | -0.04% | |
| Price / MAexp20: | +0.06% | |
| Price / MAexp50: | +0.06% | |
| Price / MAexp100: | -0.09% |
About author

Online


Add a comment
Comments
0 comments on the analysis MICRO CRUDE OIL ONLY0125 - 15 min.