| Open: | - |
| Change: | - |
| Volume: | - |
| Low: | - |
| High: | - |
| High / Low range: | - |
| Type: | Futures |
| Ticker: | MCL0125 |
| ISIN: | MCLF5 |
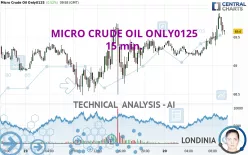
MICRO CRUDE OIL ONLY0125 - 15 min. - Technical analysis published on 11/20/2024 (GMT)
- 97
- 0
- 11/20/2024 - 10:09
Click here for a new analysis!
- Timeframe : 15 min.
- - Analysis generated on 11/20/2024 - 10:09
- Status : TARGET REACHED

Summary of the analysis
Additional analysis
Quotes
The MICRO CRUDE OIL ONLY0125 rating is 69.60 USD. The price has increased by +0.52% since the last closing and was traded between 69.16 USD and 69.92 USD over the period. The price is currently at +0.64% from its lowest and -0.46% from its highest.A bullish opening was detected by the Central Gaps scanner. Buyers are trying to impose a bullish momentum in the very short term.
Bullish opening
Type : Bullish
Timeframe : Openning
Here is a more detailed summary of the historical variations registered by MICRO CRUDE OIL ONLY0125:
Near a new LOW record (5 years)
Type : Bearish
Timeframe : Weekly
Near a new LOW record (1 month)
Type : Bearish
Timeframe : Weekly
The Central Volumes scanner detects abnormal volumes on the asset:
Abnormal volumes
Timeframe : 5 days
Abnormal volumes
Timeframe : 20 days
Abnormal volumes
Timeframe : 50 days
Technical
A technical analysis in 15 min. of this MICRO CRUDE OIL ONLY0125 chart shows a strongly bullish trend. 92.86% of the signals given by moving averages are bullish. The overall trend is supported by the strong bullish signals from short-term moving averages. The Central Indicators market scanner currently does not detect any result that concerns moving averages.
In fact, 13 technical indicators on 18 studied are currently bullish. Caution: the Central Indicators scanner currently detects an excess:
CCI indicator is overbought : over 100
Type : Neutral
Timeframe : 15 minutes
Pivot points : price is over resistance 1
Type : Neutral
Timeframe : Weekly
Central Patterns, the scanner specializing in chart patterns, did not identify any signals.
Central Candlesticks, the scanner specialised in Japanese candlesticks, detects these bearish signals that could support the hypothesis of a small drop in the very short term:
Bearish doji star
Type : Bearish
Timeframe : 15 minutes
Bearish engulfing lines
Type : Bearish
Timeframe : 15 minutes
| S3 | S2 | S1 | Price | R1 | R2 | R3 | |
|---|---|---|---|---|---|---|---|
| ProTrendLines | 66.83 | 67.64 | 68.49 | 69.60 | 69.72 | 70.29 | 71.28 |
| Change (%) | -3.98% | -2.82% | -1.59% | - | +0.17% | +0.99% | +2.41% |
| Change | -2.77 | -1.96 | -1.11 | - | +0.12 | +0.69 | +1.68 |
| Level | Major | Intermediate | Intermediate | - | Major | Minor | Intermediate |
Attention could also be paid to pivot points to set price objectives:
| Pivot points | S3 | S2 | S1 | PP | R1 | R2 | R3 |
|---|---|---|---|---|---|---|---|
| Standard | 67.31 | 67.89 | 68.57 | 69.15 | 69.83 | 70.41 | 71.09 |
| Camarilla | 68.89 | 69.01 | 69.13 | 69.24 | 69.36 | 69.47 | 69.59 |
| Woodie | 67.35 | 67.92 | 68.61 | 69.18 | 69.87 | 70.44 | 71.13 |
| Fibonacci | 67.89 | 68.38 | 68.67 | 69.15 | 69.64 | 69.93 | 70.41 |
| Pivot points | S3 | S2 | S1 | PP | R1 | R2 | R3 |
|---|---|---|---|---|---|---|---|
| Standard | 61.92 | 64.31 | 65.62 | 68.01 | 69.32 | 71.71 | 73.02 |
| Camarilla | 65.90 | 66.24 | 66.58 | 66.92 | 67.26 | 67.60 | 67.94 |
| Woodie | 61.37 | 64.04 | 65.07 | 67.74 | 68.77 | 71.44 | 72.47 |
| Fibonacci | 64.31 | 65.73 | 66.60 | 68.01 | 69.43 | 70.30 | 71.71 |
| Pivot points | S3 | S2 | S1 | PP | R1 | R2 | R3 |
|---|---|---|---|---|---|---|---|
| Standard | 53.91 | 60.11 | 64.60 | 70.80 | 75.29 | 81.49 | 85.98 |
| Camarilla | 66.14 | 67.12 | 68.10 | 69.08 | 70.06 | 71.04 | 72.02 |
| Woodie | 53.05 | 59.68 | 63.74 | 70.37 | 74.43 | 81.06 | 85.12 |
| Fibonacci | 60.11 | 64.20 | 66.72 | 70.80 | 74.89 | 77.41 | 81.49 |
Numerical data
The following are the details of the technical indicators and moving averages that were collected to generate this technical analysis:
| RSI (14): | 79.60 | |
| MACD (12,26,9): | 0.1300 | |
| Directional Movement: | 21.22 | |
| AROON (14): | 92.86 | |
| DEMA (21): | 69.63 | |
| Parabolic SAR (0,02-0,02-0,2): | 69.44 | |
| Elder Ray (13): | 0.31 | |
| Super Trend (3,10): | 69.48 | |
| Zig ZAG (10): | 69.85 | |
| VORTEX (21): | 1.2400 | |
| Stochastique (14,3,5): | 91.47 | |
| TEMA (21): | 69.72 | |
| Williams %R (14): | -17.11 | |
| Chande Momentum Oscillator (20): | 0.44 | |
| Repulse (5,40,3): | 0.0900 | |
| ROCnROLL: | 1 | |
| TRIX (15,9): | 0.0100 | |
| Courbe Coppock: | 1.15 |
| MA7: | 68.54 | |
| MA20: | 69.24 | |
| MA50: | 69.75 | |
| MA100: | 71.52 | |
| MAexp7: | 69.66 | |
| MAexp20: | 69.49 | |
| MAexp50: | 69.36 | |
| MAexp100: | 69.19 | |
| Price / MA7: | +1.55% | |
| Price / MA20: | +0.52% | |
| Price / MA50: | -0.22% | |
| Price / MA100: | -2.68% | |
| Price / MAexp7: | -0.09% | |
| Price / MAexp20: | +0.16% | |
| Price / MAexp50: | +0.35% | |
| Price / MAexp100: | +0.59% |
About author

Online


Add a comment
Comments
0 comments on the analysis MICRO CRUDE OIL ONLY0125 - 15 min.