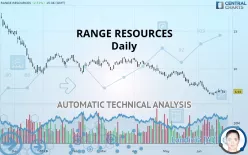
RANGE RESOURCES - Daily - Technical analysis published on 06/26/2019 (GMT)
- 297
- 0
- Who voted?
Click here for a new analysis!
- Timeframe : Daily
- - Analysis generated on
- Status : TARGET REACHED

Summary of the analysis

Additional analysis
Quotes
The RANGE RESOURCES rating is 6.93 USD. The price registered an increase of +2.52% on the session with the lowest point at 6.73 USD and the highest point at 7.01 USD. The deviation from the price is +2.97% for the low point and -1.14% for the high point.A bullish opening was detected by the Central Gaps scanner. Buyers are trying to impose a bullish momentum in the very short term.
Bullish opening
Type : Bullish
Timeframe : Openning
So that you have an overall view of the price change, here is a table showing the variations over several periods:
Near a new LOW record (5 years)
Type : Bearish
Timeframe : Weekly
Near a new LOW record (1 year)
Type : Bearish
Timeframe : Weekly
Near a new LOW record (1st january)
Type : Bearish
Timeframe : Weekly
Near a new LOW record (1 month)
Type : Bearish
Timeframe : Weekly
Technical
Technical analysis of this Daily chart of RANGE RESOURCES indicates that the overall trend is strongly bearish. 92.86% of the signals given by moving averages are bearish. This strongly bearish trend is supported by the strong bearish signals given by short-term moving averages. There is no crossing of moving average by the price or crossing of moving averages between themselves.
In fact, of the 18 technical indicators analysed by Central Analyzer, 7 are bullish, 6 are neutral and 5 are bearish. But beware of excesses. The Central Indicators scanner currently detects this:
Williams %R indicator is overbought : over -20
Type : Neutral
Timeframe : Daily
Price is back over the pivot point
Type : Bullish
Timeframe : Weekly
Price is back under the pivot point
Type : Bearish
Timeframe : Daily
Central Patterns, the scanner specializing in chart patterns, did not identify any signals.
The Central Candlesticks scanner, specialised in Japanese candlesticks, did not identify any signals.
| S2 | S1 | Price | R1 | R2 | R3 | |
|---|---|---|---|---|---|---|
| ProTrendLines | 4.12 | 6.53 | 6.93 | 9.49 | 11.81 | 15.28 |
| Change (%) | -40.55% | -5.77% | - | +36.94% | +70.42% | +120.49% |
| Change | -2.81 | -0.40 | - | +2.56 | +4.88 | +8.35 |
| Level | Intermediate | Major | - | Intermediate | Minor | Minor |
Attention could also be paid to pivot points to set price objectives:
| Pivot points | S3 | S2 | S1 | PP | R1 | R2 | R3 |
|---|---|---|---|---|---|---|---|
| Standard | 6.30 | 6.52 | 6.64 | 6.86 | 6.98 | 7.20 | 7.32 |
| Camarilla | 6.67 | 6.70 | 6.73 | 6.76 | 6.79 | 6.82 | 6.85 |
| Woodie | 6.25 | 6.49 | 6.59 | 6.84 | 6.93 | 7.18 | 7.27 |
| Fibonacci | 6.52 | 6.65 | 6.73 | 6.86 | 6.99 | 7.07 | 7.20 |
| Pivot points | S3 | S2 | S1 | PP | R1 | R2 | R3 |
|---|---|---|---|---|---|---|---|
| Standard | 5.67 | 6.05 | 6.54 | 6.92 | 7.41 | 7.79 | 8.28 |
| Camarilla | 6.79 | 6.87 | 6.95 | 7.03 | 7.11 | 7.19 | 7.27 |
| Woodie | 5.72 | 6.07 | 6.59 | 6.95 | 7.47 | 7.82 | 8.34 |
| Fibonacci | 6.05 | 6.38 | 6.58 | 6.92 | 7.25 | 7.45 | 7.79 |
Numerical data
The following is the status of the technical indicators and moving averages at the time of publication of this technical analysis:
| RSI (14): | 39.90 | |
| MACD (12,26,9): | -0.4400 | |
| Directional Movement: | -10.26 | |
| AROON (14): | -50.00 | |
| DEMA (21): | 6.58 | |
| Parabolic SAR (0,02-0,02-0,2): | 6.57 | |
| Elder Ray (13): | -0.14 | |
| Super Trend (3,10): | 7.82 | |
| Zig ZAG (10): | 6.92 | |
| VORTEX (21): | 0.8600 | |
| Stochastique (14,3,5): | 36.02 | |
| TEMA (21): | 6.63 | |
| Williams %R (14): | -52.46 | |
| Chande Momentum Oscillator (20): | -0.13 | |
| Repulse (5,40,3): | -1.3500 | |
| ROCnROLL: | 2 | |
| TRIX (15,9): | -0.9600 | |
| Courbe Coppock: | 19.55 |
| MA7: | 6.90 | |
| MA20: | 7.16 | |
| MA50: | 8.32 | |
| MA100: | 9.46 | |
| MAexp7: | 6.90 | |
| MAexp20: | 7.22 | |
| MAexp50: | 8.16 | |
| MAexp100: | 9.37 | |
| Price / MA7: | +0.43% | |
| Price / MA20: | -3.21% | |
| Price / MA50: | -16.71% | |
| Price / MA100: | -26.74% | |
| Price / MAexp7: | +0.43% | |
| Price / MAexp20: | -4.02% | |
| Price / MAexp50: | -15.07% | |
| Price / MAexp100: | -26.04% |
News
Don"t forget to follow the news on RANGE RESOURCES. At the time of publication of this analysis, the latest news was as follows:
- Investor Network: Range Resources Corporation to Host Earnings Call
- Range Announces 22% Increase in Proved Reserves; Provides Update on Resource Potential and North Louisiana Extension Wells
- Range Announces Conference Call to Discuss Fourth Quarter and Calendar Year 2016 Financial Results
- Range Issues Statement in Response to the Press Release Issued by Chapter IV Investors, LLC Dated January 3, 2017
- Range Declares Quarterly Dividend
About author

Online


Add a comment
Comments
0 comments on the analysis RANGE RESOURCES - Daily