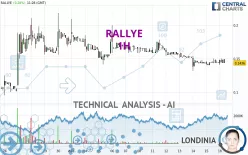
RALLYE - 1H - Technical analysis published on 12/18/2023 (GMT)
- 186
- 0
Click here for a new analysis!
- Timeframe : 1H
- - Analysis generated on
- Status : TARGET REACHED

Summary of the analysis
Additional analysis
Quotes
The RALLYE rating is 0.1490 EUR. On the day, this instrument gained +4.05% with the lowest point at 0.1400 EUR and the highest point at 0.1498 EUR. The deviation from the price is +6.43% for the low point and -0.53% for the high point.The Central Gaps scanner detects a bearish opening marking the presence of sellers ahead of buyers at the opening but not sufficiently marked to allow the price to register a quotation gap.
Bearish opening
Type : Bearish
Timeframe : Openning
A study of price movements over other periods shows the following variations:
Abnormal volumes
Timeframe : 50 days
Technical
Technical analysis of this 1H chart of RALLYE indicates that the overall trend is bearish. 75.00% of the signals given by moving averages are bearish. Caution: as the signals currently given by short-term moving averages are rather neutral, the bearish trend could slow down. An assessment of moving averages reveals a bearish signal that could impact this trend:
Bearish price crossover with Moving Average 20
Type : Bearish
Timeframe : 1 hour
In fact, Central Analyzer took into account 18 technical indicators and the result was as follows: 9 are bullish, 5 are neutral and 4 are bearish. Caution: the Central Indicators scanner currently detects an excess:
CCI indicator is overbought : over 100
Type : Neutral
Timeframe : 1 hour
RSI indicator is back over 50
Type : Bullish
Timeframe : 1 hour
Price is back under the pivot point
Type : Bearish
Timeframe : 1 hour
Momentum indicator is back over 0
Type : Bullish
Timeframe : 1 hour
Central Patterns, the market scanner focusing on chart patterns, resistances and supports found this result:
Near support of triangle
Type : Bullish
Timeframe : 1 hour
No result was found by the Central Candlesticks scanner on Japanese candlesticks.
| S3 | S2 | S1 | Price | R1 | R2 | R3 | |
|---|---|---|---|---|---|---|---|
| ProTrendLines | 0.0952 | 0.1311 | 0.1405 | 0.1490 | 0.1551 | 0.1778 | 0.2000 |
| Change (%) | -36.11% | -12.01% | -5.70% | - | +4.09% | +19.33% | +34.23% |
| Change | -0.0538 | -0.0179 | -0.0085 | - | +0.0061 | +0.0288 | +0.0510 |
| Level | Minor | Minor | Major | - | Minor | Intermediate | Minor |
Attention could also be paid to pivot points to set price objectives:
| Pivot points | S3 | S2 | S1 | PP | R1 | R2 | R3 |
|---|---|---|---|---|---|---|---|
| Standard | 0.1291 | 0.1345 | 0.1389 | 0.1443 | 0.1487 | 0.1541 | 0.1585 |
| Camarilla | 0.1405 | 0.1414 | 0.1423 | 0.1432 | 0.1441 | 0.1450 | 0.1459 |
| Woodie | 0.1285 | 0.1343 | 0.1383 | 0.1441 | 0.1481 | 0.1539 | 0.1579 |
| Fibonacci | 0.1345 | 0.1383 | 0.1406 | 0.1443 | 0.1481 | 0.1504 | 0.1541 |
| Pivot points | S3 | S2 | S1 | PP | R1 | R2 | R3 |
|---|---|---|---|---|---|---|---|
| Standard | 0.0768 | 0.1040 | 0.1236 | 0.1508 | 0.1704 | 0.1976 | 0.2172 |
| Camarilla | 0.1303 | 0.1346 | 0.1389 | 0.1432 | 0.1475 | 0.1518 | 0.1561 |
| Woodie | 0.0730 | 0.1021 | 0.1198 | 0.1489 | 0.1666 | 0.1957 | 0.2134 |
| Fibonacci | 0.1040 | 0.1219 | 0.1329 | 0.1508 | 0.1687 | 0.1797 | 0.1976 |
| Pivot points | S3 | S2 | S1 | PP | R1 | R2 | R3 |
|---|---|---|---|---|---|---|---|
| Standard | -0.4114 | -0.1885 | -0.0077 | 0.2152 | 0.3960 | 0.6189 | 0.7997 |
| Camarilla | 0.0622 | 0.0992 | 0.1362 | 0.1732 | 0.2102 | 0.2472 | 0.2842 |
| Woodie | -0.4324 | -0.1990 | -0.0287 | 0.2047 | 0.3751 | 0.6084 | 0.7788 |
| Fibonacci | -0.1885 | -0.0343 | 0.0610 | 0.2152 | 0.3694 | 0.4647 | 0.6189 |
Numerical data
The following are the details of the technical indicators and moving averages that were collected to generate this technical analysis:
| RSI (14): | 44.98 | |
| MACD (12,26,9): | -0.0020 | |
| Directional Movement: | 5.9631 | |
| AROON (14): | 35.7143 | |
| DEMA (21): | 0.1426 | |
| Parabolic SAR (0,02-0,02-0,2): | 0.1372 | |
| Elder Ray (13): | 0.0011 | |
| Super Trend (3,10): | 0.1547 | |
| Zig ZAG (10): | 0.1436 | |
| VORTEX (21): | 0.8987 | |
| Stochastique (14,3,5): | 53.74 | |
| TEMA (21): | 0.1437 | |
| Williams %R (14): | -63.27 | |
| Chande Momentum Oscillator (20): | 0.0004 | |
| Repulse (5,40,3): | -4.5486 | |
| ROCnROLL: | 2 | |
| TRIX (15,9): | -0.2673 | |
| Courbe Coppock: | 0.83 |
| MA7: | 0.1528 | |
| MA20: | 0.1549 | |
| MA50: | 0.1279 | |
| MA100: | 0.1434 | |
| MAexp7: | 0.1457 | |
| MAexp20: | 0.1458 | |
| MAexp50: | 0.1509 | |
| MAexp100: | 0.1564 | |
| Price / MA7: | -2.49% | |
| Price / MA20: | -3.81% | |
| Price / MA50: | +16.50% | |
| Price / MA100: | +3.91% | |
| Price / MAexp7: | +2.26% | |
| Price / MAexp20: | +2.19% | |
| Price / MAexp50: | -1.26% | |
| Price / MAexp100: | -4.73% |
News
Don't forget to follow the news on RALLYE. At the time of publication of this analysis, the latest news was as follows:
- RALLYE S.A.: Appeal against the decision of the Sanctions Commission of the French Financial Market Authority
- RALLYE S.A.: Opening of ad hoc proceedings
- RALLYE S.A.: Financial restructuring of Casino
- RALLYE S.A.: Extension of conciliation proceedings
- RALLYE S.A.: Appeal against the decision of the Sanctions Commission of the French Financial Market Authority
About author

Online


Add a comment
Comments
0 comments on the analysis RALLYE - 1H