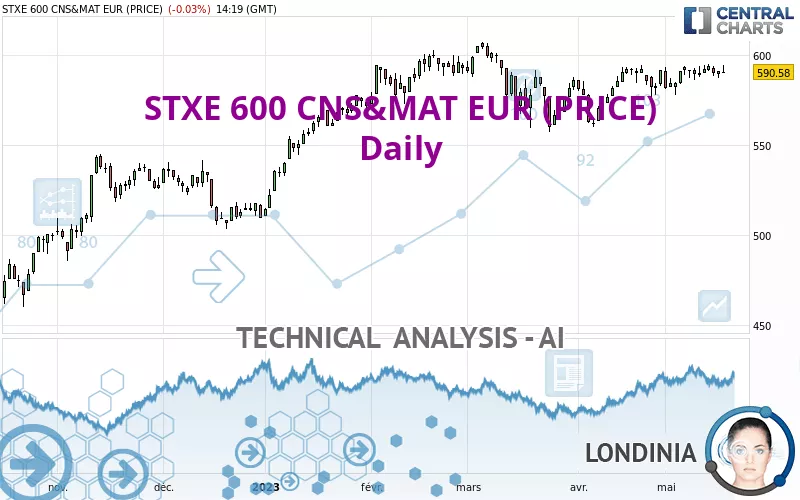
STXE 600 CNS&MAT EUR (PRICE) - Daily - Technical analysis published on 05/18/2023 (GMT)
- 121
- 0
Click here for a new analysis!
- Timeframe : Daily
- - Analysis generated on
- Status : INVALID
Summary of the analysis

Additional analysis
Quotes
STXE 600 CNS&MAT EUR (PRICE) rating 590.58 EUR. On the day, this instrument lost -0.03% and was between 590.30 EUR and 594.22 EUR. This implies that the price is at +0.05% from its lowest and at -0.61% from its highest.A bearish opening was detected by the Central Gaps scanner. Sellers are trying to impose a bearish trend in the very short term.
Bearish opening
Type : Bearish
Timeframe : Openning
So that you have an overall view of the price change, here is a table showing the variations over several periods:
Near a new HIGH record (1 year)
Type : Bullish
Timeframe : Weekly
Near a new HIGH record (1st january)
Type : Bullish
Timeframe : Weekly
Near a new LOW record (1 month)
Type : Bearish
Timeframe : Weekly
Technical
Technical analysis of this Daily chart of STXE 600 CNS&MAT EUR (PRICE) indicates that the overall trend is strongly bullish. 82.14% of the signals given by moving averages are bullish. The slightly bullish signals given by the short-term moving averages show a weakening of the global trend. The Central Indicators market scanner currently does not detect any result that concerns moving averages.
In fact, 10 technical indicators on 18 studied are currently bullish. Other results related to technical indicators were also found by the Central Indicators scanner:
MACD crosses DOWN its Moving Average
Type : Bearish
Timeframe : Daily
Momentum indicator is back over 0
Type : Bullish
Timeframe : Daily
No signals are given by Central Patterns, a market scanner specialised in chart patterns, resistances and supports.
From the Japanese candlestick perspective, the Central Candlesticks scanner notes the presence of these results that could impact the short-term trend:
White gravestone / inverted hammer
Type : Neutral
Timeframe : Daily
Black gravestone / inverted hammer
Type : Bearish
Timeframe : Daily
Bearish harami
Type : Bearish
Timeframe : Daily
Gravestone doji
Type : Bearish
Timeframe : Daily
Doji
Type : Neutral
Timeframe : Daily
| S3 | S2 | S1 | Price | R1 | R2 | R3 | |
|---|---|---|---|---|---|---|---|
| ProTrendLines | 530.04 | 542.99 | 576.81 | 590.58 | 592.81 | 604.31 | 653.17 |
| Change (%) | -10.25% | -8.06% | -2.33% | - | +0.38% | +2.32% | +10.60% |
| Change | -60.54 | -47.59 | -13.77 | - | +2.23 | +13.73 | +62.59 |
| Level | Major | Intermediate | Intermediate | - | Major | Major | Major |
Pivot points can also be used to set your price objectives. Here is the price situation in relation to pivot points:
| Pivot points | S3 | S2 | S1 | PP | R1 | R2 | R3 |
|---|---|---|---|---|---|---|---|
| Standard | 584.52 | 585.89 | 588.31 | 589.68 | 592.10 | 593.47 | 595.89 |
| Camarilla | 589.70 | 590.05 | 590.39 | 590.74 | 591.09 | 591.44 | 591.78 |
| Woodie | 585.06 | 586.15 | 588.85 | 589.94 | 592.64 | 593.73 | 596.43 |
| Fibonacci | 585.89 | 587.33 | 588.23 | 589.68 | 591.12 | 592.02 | 593.47 |
| Pivot points | S3 | S2 | S1 | PP | R1 | R2 | R3 |
|---|---|---|---|---|---|---|---|
| Standard | 579.70 | 582.97 | 587.57 | 590.84 | 595.44 | 598.71 | 603.31 |
| Camarilla | 590.01 | 590.73 | 591.45 | 592.17 | 592.89 | 593.61 | 594.33 |
| Woodie | 580.37 | 583.30 | 588.24 | 591.17 | 596.11 | 599.04 | 603.98 |
| Fibonacci | 582.97 | 585.98 | 587.83 | 590.84 | 593.85 | 595.70 | 598.71 |
| Pivot points | S3 | S2 | S1 | PP | R1 | R2 | R3 |
|---|---|---|---|---|---|---|---|
| Standard | 535.03 | 547.42 | 569.35 | 581.74 | 603.67 | 616.06 | 637.99 |
| Camarilla | 581.83 | 584.98 | 588.12 | 591.27 | 594.42 | 597.56 | 600.71 |
| Woodie | 539.79 | 549.81 | 574.11 | 584.13 | 608.43 | 618.45 | 642.75 |
| Fibonacci | 547.42 | 560.53 | 568.63 | 581.74 | 594.85 | 602.95 | 616.06 |
Numerical data
The following are the details of the technical indicators and moving averages that were collected to generate this technical analysis:
| RSI (14): | 54.18 | |
| MACD (12,26,9): | 2.4300 | |
| Directional Movement: | 4.98 | |
| AROON (14): | 78.57 | |
| DEMA (21): | 591.51 | |
| Parabolic SAR (0,02-0,02-0,2): | 584.89 | |
| Elder Ray (13): | 2.65 | |
| Super Trend (3,10): | 574.02 | |
| Zig ZAG (10): | 590.63 | |
| VORTEX (21): | 1.0100 | |
| Stochastique (14,3,5): | 73.56 | |
| TEMA (21): | 592.50 | |
| Williams %R (14): | -26.38 | |
| Chande Momentum Oscillator (20): | 9.15 | |
| Repulse (5,40,3): | -0.1100 | |
| ROCnROLL: | 1 | |
| TRIX (15,9): | 0.0600 | |
| Courbe Coppock: | 1.60 |
| MA7: | 590.86 | |
| MA20: | 588.86 | |
| MA50: | 583.46 | |
| MA100: | 576.62 | |
| MAexp7: | 590.59 | |
| MAexp20: | 588.43 | |
| MAexp50: | 583.87 | |
| MAexp100: | 572.70 | |
| Price / MA7: | -0.05% | |
| Price / MA20: | +0.29% | |
| Price / MA50: | +1.22% | |
| Price / MA100: | +2.42% | |
| Price / MAexp7: | +0.00% | |
| Price / MAexp20: | +0.37% | |
| Price / MAexp50: | +1.15% | |
| Price / MAexp100: | +3.12% |
About author
Online


Add a comment
Comments
0 comments on the analysis STXE 600 CNS&MAT EUR (PRICE) - Daily