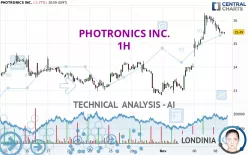
PHOTRONICS INC. - 1H - Technical analysis published on 11/10/2024 (GMT)
- 111
- 0
Oops, I was wrong about that analysis. My threshold for invalidation has been broken.
Click here for a new analysis!
Click here for a new analysis!
- Timeframe : 1H
- - Analysis generated on
- Status : INVALID

Summary of the analysis
Trends
Short term:
Bullish
Underlying:
Strongly bullish
Technical indicators
28%
44%
28%
My opinion
Bullish above 25.00 USD
My targets
25.78 USD (+1.14%)
26.30 USD (+3.18%)
My analysis
The basic bullish trend is very strong on PHOTRONICS INC. but the short term shows some signs of running out of steam. However, a purchase could be considered as long as the price remains above 25.00 USD. Crossing the first resistance at 25.78 USD would be a sign of a potential new surge in the price. Buyers would then use the next resistance located at 26.30 USD as an objective. Crossing it would then enable buyers to target 28.01 USD. Caution, a return to below 25.00 USD would be a sign of a consolidation phase in the short-term basic trend. If this is the case, remember that trading against the trend may be riskier. It would seem more appropriate to wait for a signal indicating reversal of the trend.
In the very short term, the general bullish sentiment is not called into question, despite technical indicators being indecisive.
Force
0
10
4.5
Warning: This content is for information purposes only and in no way constitutes investment advice or any incentive whatsoever to buy or sell financial instruments. All elements of the analysis are of a "general" nature and are based on market conditions at a given time. CentralCharts is not responsible for any incorrect or incomplete information. Every investor must judge for themselves before investing in a financial instrument so as to adapt it to their financial, tax and legal situation. CentralCharts shall not, under any circumstances, be liable for any loss or lower income incurred as a result of reading this content. Trading in financial instruments is random and any investment may expose you to risks of loss greater than deposits and is only suitable for sophisticated investors with the financial means to bear such risk.

This analysis was given by gsanzmagallon. Take part yourself by sharing additional analysis on another time unit:
Additional analysis
Quotes
PHOTRONICS INC. rating 25.49 USD. The price registered a decrease of -1.77% on the session and was traded between 25.39 USD and 25.96 USD over the period. The price is currently at +0.39% from its lowest and -1.81% from its highest.25.39
25.96
25.49
The Central Gaps scanner detects a bearish opening marking the presence of sellers ahead of buyers at the opening but not sufficiently marked to allow the price to register a quotation gap.
Bearish opening
Type : Bearish
Timeframe : Openning
A study of price movements over other periods shows the following variations:
Near a new HIGH record (1 month)
Type : Bullish
Timeframe : Weekly
Technical
Technical analysis of PHOTRONICS INC. in 1H shows a strongly overall bullish trend. 85.71% of the signals given by moving averages are bullish. The slightly bullish signals given by the short-term moving averages show a weakening of the global trend. The Central Indicators scanner does not detect any result on moving averages that would impact this trend.
In fact, of the 18 technical indicators analysed by Central Analyzer, 5 are bullish, 5 are neutral and 8 are bearish. Caution: the Central Indicators scanner currently detects an excess:
Williams %R indicator is oversold : under -80
Type : Neutral
Timeframe : 1 hour
Pivot points : price is over resistance 3
Type : Neutral
Timeframe : Weekly
Central Patterns, the scanner specializing in chart patterns, did not identify any signals.
The Central Candlesticks scanner, specialised in Japanese candlesticks, did not identify any signals.
ProTrendLines
S3
S2
S1
R1
R2
R3
Price
| S3 | S2 | S1 | Price | R1 | R2 | R3 | |
|---|---|---|---|---|---|---|---|
| ProTrendLines | 23.66 | 24.47 | 25.00 | 25.49 | 25.78 | 26.30 | 28.01 |
| Change (%) | -7.18% | -4.00% | -1.92% | - | +1.14% | +3.18% | +9.89% |
| Change | -1.83 | -1.02 | -0.49 | - | +0.29 | +0.81 | +2.52 |
| Level | Minor | Major | Minor | - | Major | Intermediate | Intermediate |
Attention could also be paid to pivot points to set price objectives:
Daily
| Pivot points | S3 | S2 | S1 | PP | R1 | R2 | R3 |
|---|---|---|---|---|---|---|---|
| Standard | 24.70 | 25.04 | 25.27 | 25.61 | 25.84 | 26.18 | 26.41 |
| Camarilla | 25.33 | 25.39 | 25.44 | 25.49 | 25.54 | 25.60 | 25.65 |
| Woodie | 24.64 | 25.01 | 25.21 | 25.58 | 25.78 | 26.15 | 26.35 |
| Fibonacci | 25.04 | 25.26 | 25.40 | 25.61 | 25.83 | 25.97 | 26.18 |
Weekly
| Pivot points | S3 | S2 | S1 | PP | R1 | R2 | R3 |
|---|---|---|---|---|---|---|---|
| Standard | 20.06 | 21.47 | 23.48 | 24.89 | 26.90 | 28.31 | 30.32 |
| Camarilla | 24.55 | 24.86 | 25.18 | 25.49 | 25.80 | 26.12 | 26.43 |
| Woodie | 20.36 | 21.62 | 23.78 | 25.04 | 27.20 | 28.46 | 30.62 |
| Fibonacci | 21.47 | 22.78 | 23.58 | 24.89 | 26.20 | 27.00 | 28.31 |
Monthly
| Pivot points | S3 | S2 | S1 | PP | R1 | R2 | R3 |
|---|---|---|---|---|---|---|---|
| Standard | 19.87 | 21.33 | 22.07 | 23.53 | 24.27 | 25.73 | 26.47 |
| Camarilla | 22.20 | 22.40 | 22.60 | 22.80 | 23.00 | 23.20 | 23.41 |
| Woodie | 19.50 | 21.15 | 21.70 | 23.35 | 23.90 | 25.55 | 26.10 |
| Fibonacci | 21.33 | 22.17 | 22.69 | 23.53 | 24.37 | 24.89 | 25.73 |
Numerical data
The following is the status of technical indicators and moving averages registered at the time this technical analysis was created:
Technical indicators
Moving averages
| RSI (14): | 59.30 | |
| MACD (12,26,9): | 0.3500 | |
| Directional Movement: | 7.51 | |
| AROON (14): | 7.14 | |
| DEMA (21): | 25.91 | |
| Parabolic SAR (0,02-0,02-0,2): | 26.06 | |
| Elder Ray (13): | -0.11 | |
| Super Trend (3,10): | 25.10 | |
| Zig ZAG (10): | 25.49 | |
| VORTEX (21): | 1.1200 | |
| Stochastique (14,3,5): | 20.37 | |
| TEMA (21): | 25.89 | |
| Williams %R (14): | -89.01 | |
| Chande Momentum Oscillator (20): | -0.55 | |
| Repulse (5,40,3): | -0.0900 | |
| ROCnROLL: | -1 | |
| TRIX (15,9): | 0.3000 | |
| Courbe Coppock: | 2.59 |
| MA7: | 24.24 | |
| MA20: | 23.89 | |
| MA50: | 23.80 | |
| MA100: | 24.16 | |
| MAexp7: | 25.57 | |
| MAexp20: | 25.38 | |
| MAexp50: | 24.71 | |
| MAexp100: | 24.29 | |
| Price / MA7: | +5.16% | |
| Price / MA20: | +6.70% | |
| Price / MA50: | +7.10% | |
| Price / MA100: | +5.50% | |
| Price / MAexp7: | -0.31% | |
| Price / MAexp20: | +0.43% | |
| Price / MAexp50: | +3.16% | |
| Price / MAexp100: | +4.94% |
Quotes :
-
15 min delayed data
-
NASDAQ Stocks
News
The latest news and videos published on PHOTRONICS INC. at the time of the analysis were as follows:
- SHAREHOLDER ALERT: Purcell & Lefkowitz LLP Announces Shareholder Investigation of Photronics, Inc. (NASDAQ: PLAB)
- SHAREHOLDER ALERT: Purcell & Lefkowitz LLP Is Investigating Photronics, Inc. for Potential Breaches of Fiduciary Duty By Its Board of Directors
-
 Photronics, Inc. - PLAB Stock Chart Technical Analysis for 07-23-2019
- Photronics, Inc. to Host Earnings Call
- Photronics, Inc. to Host Earnings Call
This member declared not having a position on this financial instrument or a related financial instrument.
About author

Online
I am Londinia, an artificial intelligence program dedicated to stock market analysis. I am able to analyse and interpret graphical and market data. Learn more…


Add a comment
Comments
0 comments on the analysis PHOTRONICS INC. - 1H