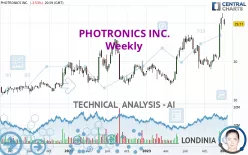
PHOTRONICS INC. - Weekly - Technical analysis published on 01/04/2024 (GMT)
- 129
- 0
Click here for a new analysis!
- Timeframe : Weekly
- - Analysis generated on
- Status : TARGET REACHED

Summary of the analysis

Additional analysis
Quotes
PHOTRONICS INC. rating 29.77 USD. The price is lower by -7.00% over the 5 days and has been traded over the last 5 days between 29.39 USD and 31.17 USD. This implies that the 5 day price is +1.29% from its lowest point and -4.49% from its highest point.The Central Gaps scanner detects the formation of a bearish gap marking the strong presence of sellers ahead of buyers at the opening. This formed a quotation gap.
Opening Gap DOWN
Type : Bearish
Timeframe : Openning
Here is a more detailed summary of the historical variations registered by PHOTRONICS INC.:
Near a new HIGH record (5 years)
Type : Bullish
Timeframe : Weekly
Near a new HIGH record (1st january)
Type : Bullish
Timeframe : Weekly
Technical
A technical analysis in Weekly of this PHOTRONICS INC. chart shows a strongly bullish trend. The signals given by the moving averages are 92.86% bullish. This strong bullish trend is confirmed by the strong signals currently being given by short-term moving averages. There is no crossing of moving average by the price or crossing of moving averages between themselves.
In fact, 13 technical indicators on 18 studied are currently bullish. Caution: the Central Indicators scanner currently detects an excess:
CCI indicator is overbought : over 100
Type : Neutral
Timeframe : Weekly
Previous candle closed over Bollinger bands
Type : Neutral
Timeframe : Weekly
Williams %R indicator is overbought : over -20
Type : Neutral
Timeframe : Weekly
Pivot points : price is under support 3
Type : Neutral
Timeframe : Weekly
No signals are given by Central Patterns, a market scanner specialised in chart patterns, resistances and supports.
Central Candlesticks, the scanner specialised in Japanese candlesticks, detects these bearish signals that could support the hypothesis of a small drop in the very short term:
Black evening star
Type : Bearish
Timeframe : Weekly
Downside gap
Type : Bearish
Timeframe : Weekly
| S3 | S2 | S1 | Price | |
|---|---|---|---|---|
| ProTrendLines | 14.22 | 19.20 | 25.78 | 29.77 |
| Change (%) | -52.23% | -35.51% | -13.40% | - |
| Change | -15.55 | -10.57 | -3.99 | - |
| Level | Major | Minor | Major | - |
Pivot points can also be used to set your price objectives. Here is the price situation in relation to pivot points:
| Pivot points | S3 | S2 | S1 | PP | R1 | R2 | R3 |
|---|---|---|---|---|---|---|---|
| Standard | 27.79 | 28.59 | 29.18 | 29.98 | 30.57 | 31.37 | 31.96 |
| Camarilla | 29.39 | 29.52 | 29.64 | 29.77 | 29.90 | 30.03 | 30.15 |
| Woodie | 27.69 | 28.54 | 29.08 | 29.93 | 30.47 | 31.32 | 31.86 |
| Fibonacci | 28.59 | 29.12 | 29.45 | 29.98 | 30.51 | 30.84 | 31.37 |
| Pivot points | S3 | S2 | S1 | PP | R1 | R2 | R3 |
|---|---|---|---|---|---|---|---|
| Standard | 29.61 | 30.46 | 30.91 | 31.76 | 32.21 | 33.06 | 33.51 |
| Camarilla | 31.01 | 31.13 | 31.25 | 31.37 | 31.49 | 31.61 | 31.73 |
| Woodie | 29.42 | 30.36 | 30.72 | 31.66 | 32.02 | 32.96 | 33.32 |
| Fibonacci | 30.46 | 30.95 | 31.26 | 31.76 | 32.25 | 32.56 | 33.06 |
| Pivot points | S3 | S2 | S1 | PP | R1 | R2 | R3 |
|---|---|---|---|---|---|---|---|
| Standard | 11.51 | 15.98 | 23.67 | 28.14 | 35.83 | 40.30 | 47.99 |
| Camarilla | 28.03 | 29.14 | 30.26 | 31.37 | 32.49 | 33.60 | 34.71 |
| Woodie | 13.13 | 16.79 | 25.29 | 28.95 | 37.45 | 41.11 | 49.61 |
| Fibonacci | 15.98 | 20.62 | 23.49 | 28.14 | 32.78 | 35.65 | 40.30 |
Numerical data
The following is the status of technical indicators and moving averages registered at the time this technical analysis was created:
| RSI (14): | 68.37 | |
| MACD (12,26,9): | 2.1500 | |
| Directional Movement: | 25.61 | |
| AROON (14): | 57.15 | |
| DEMA (21): | 26.41 | |
| Parabolic SAR (0,02-0,02-0,2): | 19.62 | |
| Elder Ray (13): | 5.00 | |
| Super Trend (3,10): | 25.33 | |
| Zig ZAG (10): | 29.77 | |
| VORTEX (21): | 1.1400 | |
| Stochastique (14,3,5): | 90.24 | |
| TEMA (21): | 27.84 | |
| Williams %R (14): | -19.42 | |
| Chande Momentum Oscillator (20): | 9.49 | |
| Repulse (5,40,3): | 9.3500 | |
| ROCnROLL: | 1 | |
| TRIX (15,9): | 0.6100 | |
| Courbe Coppock: | 63.22 |
| MA7: | 31.44 | |
| MA20: | 27.56 | |
| MA50: | 23.16 | |
| MA100: | 22.12 | |
| MAexp7: | 27.42 | |
| MAexp20: | 24.06 | |
| MAexp50: | 21.72 | |
| MAexp100: | 19.70 | |
| Price / MA7: | -5.31% | |
| Price / MA20: | +8.02% | |
| Price / MA50: | +28.54% | |
| Price / MA100: | +34.58% | |
| Price / MAexp7: | +8.57% | |
| Price / MAexp20: | +23.73% | |
| Price / MAexp50: | +37.06% | |
| Price / MAexp100: | +51.12% |
News
The latest news and videos published on PHOTRONICS INC. at the time of the analysis were as follows:
- SHAREHOLDER ALERT: Purcell & Lefkowitz LLP Is Investigating Photronics, Inc. for Potential Breaches of Fiduciary Duty By Its Board of Directors
-
 Photronics, Inc. - PLAB Stock Chart Technical Analysis for 07-23-2019
- Photronics, Inc. to Host Earnings Call
- Photronics, Inc. to Host Earnings Call
- Par Pacific Holdings and Photronics Set to Join S&P SmallCap 600
About author

Online


Add a comment
Comments
0 comments on the analysis PHOTRONICS INC. - Weekly