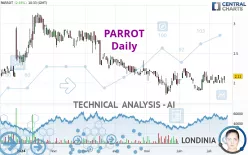
PARROT - Daily - Technical analysis published on 07/15/2024 (GMT)
- 122
- 0
Click here for a new analysis!
- Timeframe : Daily
- - Analysis generated on
- Status : INVALID

Summary of the analysis

Additional analysis
Quotes
The PARROT price is 2.110 EUR. On the day, this instrument gained +2.93% with the lowest point at 2.000 EUR and the highest point at 2.110 EUR. The deviation from the price is +5.50% for the low point and 0% for the high point.Here is a more detailed summary of the historical variations registered by PARROT:
Near a new HIGH record (1 month)
Type : Bullish
Timeframe : Weekly
Technical
Technical analysis of PARROT in Daily shows an overall slightly bearish trend. Only 57.14% of the signals given by moving averages are bearish. This slightly bearish trend could quickly be reversed due to the strong bullish signals currently being given by short-term moving averages. The Central Indicators market scanner is currently detecting several bullish signals that could impact this trend:
Bullish price crossover with adaptative moving average 20
Type : Bullish
Timeframe : Daily
Bullish price crossover with adaptative moving average 50
Type : Bullish
Timeframe : Daily
An assessment of technical indicators shows a moderate bullish signal.
Other results related to technical indicators were also found by the Central Indicators scanner:
Pivot points : price is over resistance 1
Type : Neutral
Timeframe : Daily
RSI indicator is back over 50
Type : Bullish
Timeframe : Daily
Aroon indicator bearish trend
Type : Bearish
Timeframe : Daily
Price is back over the pivot point
Type : Bullish
Timeframe : Weekly
Momentum indicator is back over 0
Type : Bullish
Timeframe : Daily
Williams %R indicator is back over -50
Type : Bullish
Timeframe : Daily
The Central Patterns scanner, which studies chart patterns, resistances and supports, has identified these signals:
Near horizontal resistance
Type : Bearish
Timeframe : Daily
Near resistance of channel
Type : Bearish
Timeframe : Daily
The Central Candlesticks scanner, specialised in Japanese candlesticks, did not identify any signals.
| S1 | Price | R1 | R2 | R3 | |
|---|---|---|---|---|---|
| ProTrendLines | 1.801 | 2.110 | 2.125 | 2.642 | 2.885 |
| Change (%) | -14.64% | - | +0.71% | +25.21% | +36.73% |
| Change | -0.309 | - | +0.015 | +0.532 | +0.775 |
| Level | Major | - | Major | Minor | Minor |
Pivot points can also be used to set your price objectives. Here is the price situation in relation to pivot points:
| Pivot points | S3 | S2 | S1 | PP | R1 | R2 | R3 |
|---|---|---|---|---|---|---|---|
| Standard | 1.910 | 1.950 | 2.000 | 2.040 | 2.090 | 2.130 | 2.180 |
| Camarilla | 2.025 | 2.034 | 2.042 | 2.050 | 2.058 | 2.067 | 2.075 |
| Woodie | 1.915 | 1.953 | 2.005 | 2.043 | 2.095 | 2.133 | 2.185 |
| Fibonacci | 1.950 | 1.984 | 2.006 | 2.040 | 2.074 | 2.096 | 2.130 |
| Pivot points | S3 | S2 | S1 | PP | R1 | R2 | R3 |
|---|---|---|---|---|---|---|---|
| Standard | 1.843 | 1.917 | 1.983 | 2.057 | 2.123 | 2.197 | 2.263 |
| Camarilla | 2.012 | 2.024 | 2.037 | 2.050 | 2.063 | 2.076 | 2.089 |
| Woodie | 1.840 | 1.915 | 1.980 | 2.055 | 2.120 | 2.195 | 2.260 |
| Fibonacci | 1.917 | 1.970 | 2.003 | 2.057 | 2.110 | 2.143 | 2.197 |
| Pivot points | S3 | S2 | S1 | PP | R1 | R2 | R3 |
|---|---|---|---|---|---|---|---|
| Standard | 1.463 | 1.667 | 1.833 | 2.037 | 2.203 | 2.407 | 2.573 |
| Camarilla | 1.898 | 1.932 | 1.966 | 2.000 | 2.034 | 2.068 | 2.102 |
| Woodie | 1.445 | 1.658 | 1.815 | 2.028 | 2.185 | 2.398 | 2.555 |
| Fibonacci | 1.667 | 1.808 | 1.895 | 2.037 | 2.178 | 2.265 | 2.407 |
Numerical data
The following is the status of technical indicators and moving averages registered at the time this technical analysis was created:
| RSI (14): | 54.99 | |
| MACD (12,26,9): | 0.0070 | |
| Directional Movement: | 10.608 | |
| AROON (14): | -42.857 | |
| DEMA (21): | 2.058 | |
| Parabolic SAR (0,02-0,02-0,2): | 2.196 | |
| Elder Ray (13): | -0.004 | |
| Super Trend (3,10): | 2.152 | |
| Zig ZAG (10): | 2.110 | |
| VORTEX (21): | 0.9850 | |
| Stochastique (14,3,5): | 49.41 | |
| TEMA (21): | 2.083 | |
| Williams %R (14): | -42.86 | |
| Chande Momentum Oscillator (20): | 0.070 | |
| Repulse (5,40,3): | 7.3950 | |
| ROCnROLL: | -1 | |
| TRIX (15,9): | 0.0030 | |
| Courbe Coppock: | 6.86 |
| MA7: | 2.071 | |
| MA20: | 2.031 | |
| MA50: | 2.044 | |
| MA100: | 2.236 | |
| MAexp7: | 2.070 | |
| MAexp20: | 2.054 | |
| MAexp50: | 2.089 | |
| MAexp100: | 2.229 | |
| Price / MA7: | +1.88% | |
| Price / MA20: | +3.89% | |
| Price / MA50: | +3.23% | |
| Price / MA100: | -5.64% | |
| Price / MAexp7: | +1.93% | |
| Price / MAexp20: | +2.73% | |
| Price / MAexp50: | +1.01% | |
| Price / MAexp100: | -5.34% |
News
Don't forget to follow the news on PARROT. At the time of publication of this analysis, the latest news was as follows:
- PARROT: 2024 FIRST-QUARTER BUSINESS
- PARROT: 2023 FULL-YEAR EARNINGS
- PARROT: 2023 THIRD-QUARTER BUSINESS
- PARROT: 2023 FIRST-HALF EARNINGS
- PARROT: 2023 FIRST-QUARTER BUSINESS
About author
Online


Add a comment
Comments
0 comments on the analysis PARROT - Daily