ARTHUR J. GALLAGHER & CO. - 1H - Technical analysis published on 01/31/2025 (GMT)
- 97
- 0
Click here for a new analysis!
- Timeframe : 1H
- - Analysis generated on
- Status : TARGET REACHED
Summary of the analysis

Additional analysis
Quotes
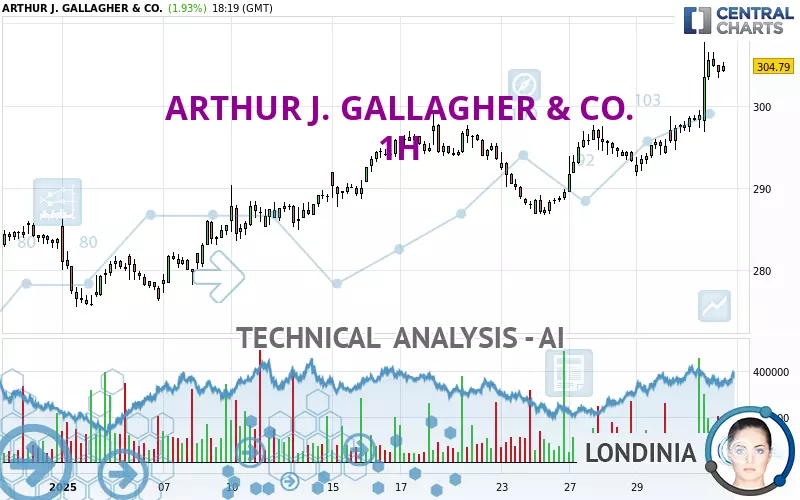
The ARTHUR J. GALLAGHER & CO. price is 304.79 USD. The price registered an increase of +1.93% on the session and was between 296.83 USD and 307.74 USD. This implies that the price is at +2.68% from its lowest and at -0.96% from its highest.So that you have an overall view of the price change, here is a table showing the variations over several periods:
Near a new HIGH record (5 years)
Type : Bullish
Timeframe : Weekly
Near a new HIGH record (1 year)
Type : Bullish
Timeframe : Weekly
New HIGH record (1st january)
Type : Bullish
Timeframe : Weekly
New HIGH record (1 month)
Type : Bullish
Timeframe : Weekly
Technical
Technical analysis of this 1H chart of ARTHUR J. GALLAGHER & CO. indicates that the overall trend is strongly bullish. 92.86% of the signals given by moving averages are bullish. This strongly bullish trend is supported by the strong bullish signals given by short-term moving averages. There is no crossing of moving average by the price or crossing of moving averages between themselves.
In fact, according to the parameters integrated into the Central Analyzer system, 14 technical indicators out of 18 analysed are currently bullish. Central Indicators, the scanner specialised in technical indicators, has identified this signal:
Pivot points : price is over resistance 2
Type : Neutral
Timeframe : Weekly
Central Patterns, the market scanner focusing on chart patterns, resistances and supports found this result:
Resistance of channel is broken
Type : Bullish
Timeframe : 1 hour
There is also a Japanese candlestick pattern detected by Central Candlesticks that could mark the end of the current short-term trend:
Black hanging man / hammer
Type : Neutral
Timeframe : 1 hour
| S3 | S2 | S1 | Price | R1 | |
|---|---|---|---|---|---|
| ProTrendLines | 281.93 | 288.29 | 298.96 | 304.79 | 314.54 |
| Change (%) | -7.50% | -5.41% | -1.91% | - | +3.20% |
| Change | -22.86 | -16.50 | -5.83 | - | +9.75 |
| Level | Minor | Major | Major | - | Major |
Pivot points can also be used to set your price objectives. Here is the price situation in relation to pivot points:
| Pivot points | S3 | S2 | S1 | PP | R1 | R2 | R3 |
|---|---|---|---|---|---|---|---|
| Standard | 291.10 | 292.85 | 295.94 | 297.69 | 300.78 | 302.53 | 305.62 |
| Camarilla | 297.70 | 298.14 | 298.59 | 299.03 | 299.47 | 299.92 | 300.36 |
| Woodie | 291.77 | 293.19 | 296.61 | 298.03 | 301.45 | 302.87 | 306.29 |
| Fibonacci | 292.85 | 294.70 | 295.84 | 297.69 | 299.54 | 300.68 | 302.53 |
| Pivot points | S3 | S2 | S1 | PP | R1 | R2 | R3 |
|---|---|---|---|---|---|---|---|
| Standard | 272.29 | 279.54 | 284.52 | 291.77 | 296.75 | 304.00 | 308.98 |
| Camarilla | 286.15 | 287.27 | 288.39 | 289.51 | 290.63 | 291.75 | 292.87 |
| Woodie | 271.17 | 278.97 | 283.40 | 291.20 | 295.63 | 303.43 | 307.86 |
| Fibonacci | 279.54 | 284.21 | 287.10 | 291.77 | 296.44 | 299.33 | 304.00 |
| Pivot points | S3 | S2 | S1 | PP | R1 | R2 | R3 |
|---|---|---|---|---|---|---|---|
| Standard | 234.21 | 255.56 | 269.70 | 291.05 | 305.19 | 326.54 | 340.68 |
| Camarilla | 274.09 | 277.34 | 280.60 | 283.85 | 287.10 | 290.36 | 293.61 |
| Woodie | 230.62 | 253.76 | 266.11 | 289.25 | 301.60 | 324.74 | 337.09 |
| Fibonacci | 255.56 | 269.11 | 277.49 | 291.05 | 304.60 | 312.98 | 326.54 |
Numerical data
The following is the status of technical indicators and moving averages registered at the time this technical analysis was created:
| RSI (14): | 74.77 | |
| MACD (12,26,9): | 2.7400 | |
| Directional Movement: | 19.66 | |
| AROON (14): | 78.57 | |
| DEMA (21): | 301.98 | |
| Parabolic SAR (0,02-0,02-0,2): | 298.14 | |
| Elder Ray (13): | 3.81 | |
| Super Trend (3,10): | 297.48 | |
| Zig ZAG (10): | 304.34 | |
| VORTEX (21): | 1.1700 | |
| Stochastique (14,3,5): | 79.49 | |
| TEMA (21): | 303.70 | |
| Williams %R (14): | -25.80 | |
| Chande Momentum Oscillator (20): | 9.09 | |
| Repulse (5,40,3): | 0.4600 | |
| ROCnROLL: | 1 | |
| TRIX (15,9): | 0.0900 | |
| Courbe Coppock: | 5.36 |
| MA7: | 294.90 | |
| MA20: | 289.76 | |
| MA50: | 291.97 | |
| MA100: | 289.96 | |
| MAexp7: | 302.80 | |
| MAexp20: | 298.79 | |
| MAexp50: | 295.67 | |
| MAexp100: | 292.99 | |
| Price / MA7: | +3.35% | |
| Price / MA20: | +5.19% | |
| Price / MA50: | +4.39% | |
| Price / MA100: | +5.11% | |
| Price / MAexp7: | +0.66% | |
| Price / MAexp20: | +2.01% | |
| Price / MAexp50: | +3.08% | |
| Price / MAexp100: | +4.03% |
News
Don't forget to follow the news on ARTHUR J. GALLAGHER & CO.. At the time of publication of this analysis, the latest news was as follows:
- Arthur J. Gallagher & Co. Announces Fourth Quarter and Full Year 2024 Financial Results
- Arthur J. Gallagher & Co. Increases Cash Dividend to $0.65 per Share
- Arthur J. Gallagher & Co. Acquires Wealth Management Partners Pty Ltd
- Arthur J. Gallagher & Co. Announces Fourth Quarter 2024 Earnings Release And Conference Call Date
- Arthur J. Gallagher & Co. Acquires Encore Group
About author
Online


Add a comment
Comments
0 comments on the analysis ARTHUR J. GALLAGHER & CO. - 1H