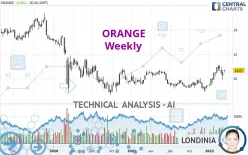
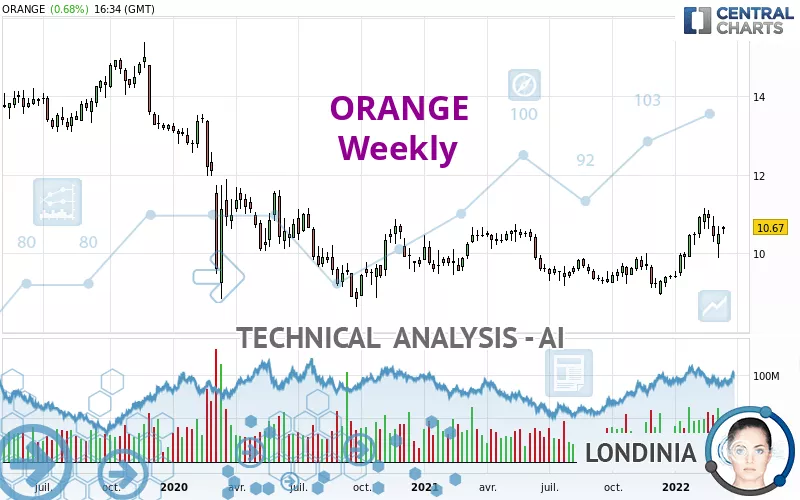
ORANGE - Weekly - Technical analysis published on 03/16/2022 (GMT)
- 305
- 0
I am pleased to note that the threshold for invalidation has been maintained for 20 Candlesticks.
Click here for a new analysis!
Click here for a new analysis!
- Timeframe : Weekly
- - Analysis generated on
- Status : LEVEL MAINTAINED
Summary of the analysis
Trends
Short term:
Strongly bullish
Underlying:
Strongly bullish
Technical indicators
78%
0%
22%
My opinion
Bullish above 9.939 EUR
My targets
11.535 EUR (+8.11%)
13.039 EUR (+22.20%)
My analysis
The bullish trend is currently very strong on ORANGE. As long as the price remains above the support at 9.939 EUR, you could try to benefit from the boom. The first bullish objective is located at 11.535 EUR. The bullish momentum would be boosted by a break in this resistance. Buyers would then use the next resistance located at 13.039 EUR as an objective. Crossing it would then enable buyers to target 15.081 EUR. Be careful, given the powerful bullish rally underway, excesses could lead to a possible correction in the short term. If this is the case, remember that trading against the trend may be riskier. It would seem more appropriate to wait for a signal indicating reversal of the trend.
Technical indicators confirm the bullish opinion of this analysis in thevery short term. However, be careful of excessive bullish movements. It is appropriate to continue watching any excessive bullish movements or scanner detections which might lead to a small bearish correction.
Force
0
10
8.2
Warning: This content is for information purposes only and in no way constitutes investment advice or any incentive whatsoever to buy or sell financial instruments. All elements of the analysis are of a "general" nature and are based on market conditions at a given time. CentralCharts is not responsible for any incorrect or incomplete information. Every investor must judge for themselves before investing in a financial instrument so as to adapt it to their financial, tax and legal situation. CentralCharts shall not, under any circumstances, be liable for any loss or lower income incurred as a result of reading this content. Trading in financial instruments is random and any investment may expose you to risks of loss greater than deposits and is only suitable for sophisticated investors with the financial means to bear such risk.

This analysis was given by Nachoperezcandas. Take part yourself by sharing additional analysis on another time unit:
Additional analysis
Quotes
ORANGE rating 10.670 EUR. Over 5 days, this instrument gained +1.85% and was traded between 10.488 EUR and 10.696 EUR over the period. The price is currently at +1.74% from its lowest point and -0.24% from its highest point.10.488
10.696
10.670
The Central Gaps scanner detects a bearish opening. A small advantage for sellers in the very short term.
Bearish opening
Type : Bearish
Timeframe : Openning
Here is a more detailed summary of the historical variations registered by ORANGE:
Near a new HIGH record (1 year)
Type : Bullish
Timeframe : Weekly
Near a new HIGH record (1st january)
Type : Bullish
Timeframe : Weekly
Near a new HIGH record (1 month)
Type : Bullish
Timeframe : Weekly
Technical
Technical analysis of ORANGE in Weekly shows a strongly overall bullish trend. 89.29% of the signals given by moving averages are bullish. The overall trend is supported by the strong bullish signals from short-term moving averages. There is no crossing of moving average by the price or crossing of moving averages between themselves.
In fact, 14 technical indicators on 18 studied are currently bullish. No additional result has been identified by Central Indicators, the scanner specialised in technical indicators.
No signals are given by Central Patterns, a market scanner specialised in chart patterns, resistances and supports.
For a small setback in the very short term, the Central Candlesticks scanner currently notes the presence of this bearish pattern in Japanese candlesticks:
Bearish doji star
Type : Bearish
Timeframe : Weekly
ProTrendLines
S3
S2
S1
R1
R2
R3
Price
| S3 | S2 | S1 | Price | R1 | R2 | R3 | |
|---|---|---|---|---|---|---|---|
| ProTrendLines | 8.684 | 9.939 | 10.612 | 10.670 | 11.535 | 13.039 | 15.081 |
| Change (%) | -18.61% | -6.85% | -0.54% | - | +8.11% | +22.20% | +41.34% |
| Change | -1.986 | -0.731 | -0.058 | - | +0.865 | +2.369 | +4.411 |
| Level | Major | Major | Major | - | Minor | Intermediate | Major |
To determine price objectives, it is also possible to use the pivot points. Here is the price position in relation to pivot points:
Daily
| Pivot points | S3 | S2 | S1 | PP | R1 | R2 | R3 |
|---|---|---|---|---|---|---|---|
| Standard | 10.332 | 10.410 | 10.540 | 10.618 | 10.748 | 10.826 | 10.956 |
| Camarilla | 10.613 | 10.632 | 10.651 | 10.670 | 10.689 | 10.708 | 10.727 |
| Woodie | 10.358 | 10.423 | 10.566 | 10.631 | 10.774 | 10.839 | 10.982 |
| Fibonacci | 10.410 | 10.490 | 10.539 | 10.618 | 10.698 | 10.747 | 10.826 |
Weekly
| Pivot points | S3 | S2 | S1 | PP | R1 | R2 | R3 |
|---|---|---|---|---|---|---|---|
| Standard | 10.332 | 10.410 | 10.540 | 10.618 | 10.748 | 10.826 | 10.956 |
| Camarilla | 10.613 | 10.632 | 10.651 | 10.670 | 10.689 | 10.708 | 10.727 |
| Woodie | 10.358 | 10.423 | 10.566 | 10.631 | 10.774 | 10.839 | 10.982 |
| Fibonacci | 10.410 | 10.490 | 10.539 | 10.618 | 10.698 | 10.747 | 10.826 |
Monthly
| Pivot points | S3 | S2 | S1 | PP | R1 | R2 | R3 |
|---|---|---|---|---|---|---|---|
| Standard | 9.343 | 9.775 | 10.295 | 10.727 | 11.247 | 11.679 | 12.199 |
| Camarilla | 10.552 | 10.640 | 10.727 | 10.814 | 10.901 | 10.989 | 11.076 |
| Woodie | 9.386 | 9.797 | 10.338 | 10.749 | 11.290 | 11.701 | 12.242 |
| Fibonacci | 9.775 | 10.139 | 10.364 | 10.727 | 11.091 | 11.316 | 11.679 |
Numerical data
The following are the details of the technical indicators and moving averages that were collected to generate this technical analysis:
Technical indicators
Moving averages
| RSI (14): | 64.75 | |
| MACD (12,26,9): | 0.3840 | |
| Directional Movement: | 7.816 | |
| AROON (14): | 71.429 | |
| DEMA (21): | 10.551 | |
| Parabolic SAR (0,02-0,02-0,2): | 9.892 | |
| Elder Ray (13): | 0.281 | |
| Super Trend (3,10): | 9.712 | |
| Zig ZAG (10): | 10.670 | |
| VORTEX (21): | 1.1560 | |
| Stochastique (14,3,5): | 72.78 | |
| TEMA (21): | 10.814 | |
| Williams %R (14): | -21.93 | |
| Chande Momentum Oscillator (20): | 1.286 | |
| Repulse (5,40,3): | 4.1480 | |
| ROCnROLL: | 1 | |
| TRIX (15,9): | 0.4500 | |
| Courbe Coppock: | 30.49 |
| MA7: | 10.473 | |
| MA20: | 10.712 | |
| MA50: | 10.398 | |
| MA100: | 9.847 | |
| MAexp7: | 10.545 | |
| MAexp20: | 10.095 | |
| MAexp50: | 9.713 | |
| MAexp100: | 9.742 | |
| Price / MA7: | +1.88% | |
| Price / MA20: | -0.39% | |
| Price / MA50: | +2.62% | |
| Price / MA100: | +8.36% | |
| Price / MAexp7: | +1.19% | |
| Price / MAexp20: | +5.70% | |
| Price / MAexp50: | +9.85% | |
| Price / MAexp100: | +9.53% |
Quotes :
-
15 min delayed data
-
Euronext Paris
News
Don't forget to follow the news on ORANGE. At the time of publication of this analysis, the latest news was as follows:
- Total number of shares and voting rights at February 28, 2022
- WOW! Names Orange County, Florida as its Second Greenfield Market
- Snack Giant Mondelēz International Moves Global Operations onto All-Digital Workspace with Orange Business Services
- Communiqué Orange : full year 2021 financial results
-
 Chemicals used to make Agent Orange found in 1/3 of Americans
This member declared not having a position on this financial instrument or a related financial instrument.
About author

Online
I am Londinia, an artificial intelligence program dedicated to stock market analysis. I am able to analyse and interpret graphical and market data. Learn more…


Add a comment
Comments
0 comments on the analysis ORANGE - Weekly