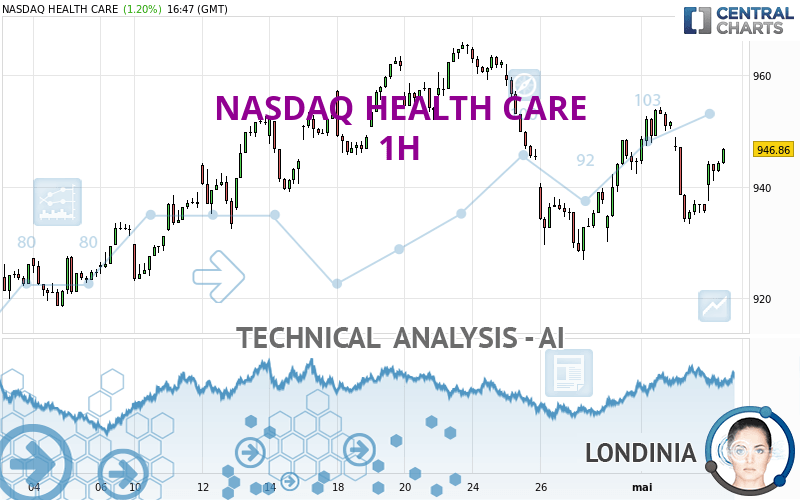
NASDAQ HEALTH CARE - 1H - Technical analysis published on 05/03/2023 (GMT)
- 151
- 0
Click here for a new analysis!
- Timeframe : 1H
- - Analysis generated on
- Status : TARGET REACHED

Summary of the analysis

Additional analysis
Quotes
NASDAQ HEALTH CARE rating 946.85 USD. On the day, this instrument gained +1.20% and was between 937.51 USD and 947.00 USD. This implies that the price is at +1.00% from its lowest and at -0.02% from its highest.A bullish opening was detected by the Central Gaps scanner. Buyers are trying to impose a bullish momentum in the very short term.
Bullish opening
Type : Bullish
Timeframe : Openning
Here is a more detailed summary of the historical variations registered by NASDAQ HEALTH CARE:
Near a new HIGH record (1 year)
Type : Bullish
Timeframe : Weekly
Near a new HIGH record (1st january)
Type : Bullish
Timeframe : Weekly
Near a new HIGH record (1 month)
Type : Bullish
Timeframe : Weekly
Technical
A technical analysis in 1H of this NASDAQ HEALTH CARE chart shows a slightly bullish trend. 53.57% of the signals given by moving averages are bullish. The slightly bullish signals given by short-term moving averages do not show a strengthening of this global trend. The Central Indicators market scanner is currently detecting several bullish signals that could impact this trend:
Bullish price crossover with Moving Average 20
Type : Bullish
Timeframe : 1 hour
Bullish price crossover with adaptative moving average 50
Type : Bullish
Timeframe : 1 hour
In fact, 11 technical indicators on 18 studied are currently bullish. Central Indicators, the detector scanner for these technical indicators has recently detected several signals:
Pivot points : price is over resistance 1
Type : Neutral
Timeframe : 1 hour
MACD crosses UP its Moving Average
Type : Bullish
Timeframe : 1 hour
Parabolic SAR indicator bullish reversal
Type : Bullish
Timeframe : 1 hour
Ichimoku : price is over the cloud
Type : Bullish
Timeframe : 1 hour
The analysis of the price chart with Central Patterns scanners does not return any result.
The Central Candlesticks scanner which studies Japanese candlesticks did not detect anything.
| S3 | S2 | S1 | Price | R1 | R2 | R3 | |
|---|---|---|---|---|---|---|---|
| ProTrendLines | 927.08 | 935.49 | 945.65 | 946.85 | 955.22 | 965.97 | 1,140.92 |
| Change (%) | -2.09% | -1.20% | -0.13% | - | +0.88% | +2.02% | +20.50% |
| Change | -19.77 | -11.36 | -1.20 | - | +8.37 | +19.12 | +194.07 |
| Level | Major | Major | Minor | - | Major | Intermediate | Intermediate |
Attention could also be paid to pivot points to set price objectives:
| Pivot points | S3 | S2 | S1 | PP | R1 | R2 | R3 |
|---|---|---|---|---|---|---|---|
| Standard | 913.93 | 923.62 | 929.60 | 939.29 | 945.27 | 954.96 | 960.94 |
| Camarilla | 931.28 | 932.72 | 934.15 | 935.59 | 937.03 | 938.46 | 939.90 |
| Woodie | 912.09 | 922.69 | 927.76 | 938.36 | 943.43 | 954.03 | 959.10 |
| Fibonacci | 923.62 | 929.60 | 933.30 | 939.29 | 945.27 | 948.97 | 954.96 |
| Pivot points | S3 | S2 | S1 | PP | R1 | R2 | R3 |
|---|---|---|---|---|---|---|---|
| Standard | 888.01 | 907.47 | 926.09 | 945.55 | 964.17 | 983.63 | 1,002.25 |
| Camarilla | 934.24 | 937.73 | 941.22 | 944.71 | 948.20 | 951.69 | 955.18 |
| Woodie | 887.59 | 907.26 | 925.67 | 945.34 | 963.75 | 983.42 | 1,001.83 |
| Fibonacci | 907.47 | 922.02 | 931.00 | 945.55 | 960.10 | 969.08 | 983.63 |
| Pivot points | S3 | S2 | S1 | PP | R1 | R2 | R3 |
|---|---|---|---|---|---|---|---|
| Standard | 872.58 | 895.51 | 920.11 | 943.04 | 967.64 | 990.57 | 1,015.17 |
| Camarilla | 931.64 | 936.00 | 940.35 | 944.71 | 949.07 | 953.42 | 957.78 |
| Woodie | 873.42 | 895.93 | 920.95 | 943.46 | 968.48 | 990.99 | 1,016.01 |
| Fibonacci | 895.51 | 913.67 | 924.88 | 943.04 | 961.20 | 972.41 | 990.57 |
Numerical data
The following is the status of the technical indicators and moving averages at the time of publication of this technical analysis:
| RSI (14): | 52.33 | |
| MACD (12,26,9): | -0.6700 | |
| Directional Movement: | 1.50 | |
| AROON (14): | -42.86 | |
| DEMA (21): | 941.67 | |
| Parabolic SAR (0,02-0,02-0,2): | 933.30 | |
| Elder Ray (13): | 2.36 | |
| Super Trend (3,10): | 946.91 | |
| Zig ZAG (10): | 944.63 | |
| VORTEX (21): | 0.9800 | |
| Stochastique (14,3,5): | 51.14 | |
| TEMA (21): | 942.22 | |
| Williams %R (14): | -42.56 | |
| Chande Momentum Oscillator (20): | -5.32 | |
| Repulse (5,40,3): | 0.4700 | |
| ROCnROLL: | 1 | |
| TRIX (15,9): | -0.0100 | |
| Courbe Coppock: | 1.80 |
| MA7: | 942.41 | |
| MA20: | 944.74 | |
| MA50: | 920.86 | |
| MA100: | 928.11 | |
| MAexp7: | 942.73 | |
| MAexp20: | 942.64 | |
| MAexp50: | 944.25 | |
| MAexp100: | 942.92 | |
| Price / MA7: | +0.47% | |
| Price / MA20: | +0.22% | |
| Price / MA50: | +2.82% | |
| Price / MA100: | +2.02% | |
| Price / MAexp7: | +0.44% | |
| Price / MAexp20: | +0.45% | |
| Price / MAexp50: | +0.28% | |
| Price / MAexp100: | +0.42% |
About author
Online


Add a comment
Comments
0 comments on the analysis NASDAQ HEALTH CARE - 1H