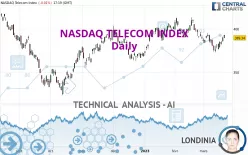
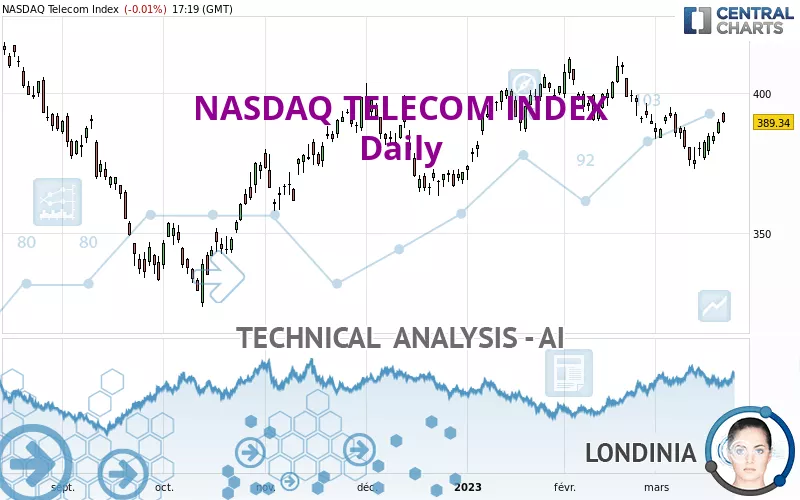
NASDAQ TELECOM INDEX - Daily - Technical analysis published on 03/21/2023 (GMT)
- 242
- 0
Click here for a new analysis!
- Timeframe : Daily
- - Analysis generated on
- Status : TARGET REACHED
Summary of the analysis

Additional analysis
Quotes
The NASDAQ TELECOM INDEX rating is 389.36 USD. The price is lower by -0.01% since the last closing with the lowest point at 389.13 USD and the highest point at 393.10 USD. The deviation from the price is +0.06% for the low point and -0.95% for the high point.A bullish gap was detected at the opening by the Central Gaps scanner. There are a lot of buyers and they have the upper hand in the very short term.
Opening Gap UP
Type : Bullish
Timeframe : Openning
Here is a more detailed summary of the historical variations registered by NASDAQ TELECOM INDEX:
Near a new LOW record (1 month)
Type : Bearish
Timeframe : Weekly
Technical
A technical analysis in Daily of this NASDAQ TELECOM INDEX chart shows a bullish trend. 64.29% of the signals given by moving averages are bullish. The overall trend seems to be showing some signs of weakness, as do the tentative bullish signals given by short-term moving averages. An assessment of moving averages reveals several bullish signals that could impact this trend:
Bullish trend reversal : adaptative moving average 20
Type : Bullish
Timeframe : Daily
Bullish trend reversal : adaptative moving average 50
Type : Bullish
Timeframe : Daily
Bullish trend reversal : adaptative moving average 100
Type : Bullish
Timeframe : Daily
An assessment of technical indicators shows a moderate bullish signal.
Other results related to technical indicators were also found by the Central Indicators scanner:
Pivot points : price is over resistance 1
Type : Neutral
Timeframe : Weekly
Momentum indicator is back under 0
Type : Bearish
Timeframe : Daily
Central Patterns, the scanner specializing in chart patterns, did not identify any signals.
No result was found by the Central Candlesticks scanner on Japanese candlesticks.
| S3 | S2 | S1 | Price | R1 | R2 | R3 | |
|---|---|---|---|---|---|---|---|
| ProTrendLines | 329.24 | 353.55 | 372.30 | 389.36 | 394.59 | 405.37 | 417.74 |
| Change (%) | -15.44% | -9.20% | -4.38% | - | +1.34% | +4.11% | +7.29% |
| Change | -60.12 | -35.81 | -17.06 | - | +5.23 | +16.01 | +28.38 |
| Level | Major | Minor | Major | - | Major | Intermediate | Major |
Attention could also be paid to pivot points to set price objectives:
| Pivot points | S3 | S2 | S1 | PP | R1 | R2 | R3 |
|---|---|---|---|---|---|---|---|
| Standard | 381.04 | 383.12 | 386.25 | 388.33 | 391.46 | 393.54 | 396.67 |
| Camarilla | 387.95 | 388.43 | 388.90 | 389.38 | 389.86 | 390.34 | 390.81 |
| Woodie | 381.57 | 383.38 | 386.78 | 388.59 | 391.99 | 393.80 | 397.20 |
| Fibonacci | 383.12 | 385.11 | 386.34 | 388.33 | 390.32 | 391.55 | 393.54 |
| Pivot points | S3 | S2 | S1 | PP | R1 | R2 | R3 |
|---|---|---|---|---|---|---|---|
| Standard | 362.90 | 367.81 | 376.12 | 381.03 | 389.34 | 394.25 | 402.56 |
| Camarilla | 380.80 | 382.01 | 383.22 | 384.43 | 385.64 | 386.85 | 388.07 |
| Woodie | 364.60 | 368.66 | 377.82 | 381.88 | 391.04 | 395.10 | 404.26 |
| Fibonacci | 367.81 | 372.86 | 375.98 | 381.03 | 386.08 | 389.20 | 394.25 |
| Pivot points | S3 | S2 | S1 | PP | R1 | R2 | R3 |
|---|---|---|---|---|---|---|---|
| Standard | 356.36 | 372.49 | 380.62 | 396.75 | 404.88 | 421.01 | 429.14 |
| Camarilla | 382.09 | 384.31 | 386.54 | 388.76 | 390.98 | 393.21 | 395.43 |
| Woodie | 352.37 | 370.49 | 376.63 | 394.75 | 400.89 | 419.01 | 425.15 |
| Fibonacci | 372.49 | 381.75 | 387.48 | 396.75 | 406.01 | 411.74 | 421.01 |
Numerical data
The following are the details of the technical indicators and moving averages that were collected to generate this technical analysis:
| RSI (14): | 51.03 | |
| MACD (12,26,9): | -2.5900 | |
| Directional Movement: | 0.73 | |
| AROON (14): | -35.71 | |
| DEMA (21): | 383.81 | |
| Parabolic SAR (0,02-0,02-0,2): | 373.07 | |
| Elder Ray (13): | 5.19 | |
| Super Trend (3,10): | 395.63 | |
| Zig ZAG (10): | 389.21 | |
| VORTEX (21): | 0.7800 | |
| Stochastique (14,3,5): | 68.01 | |
| TEMA (21): | 381.95 | |
| Williams %R (14): | -25.12 | |
| Chande Momentum Oscillator (20): | -2.03 | |
| Repulse (5,40,3): | 0.5800 | |
| ROCnROLL: | 1 | |
| TRIX (15,9): | -0.1300 | |
| Courbe Coppock: | 3.84 |
| MA7: | 383.74 | |
| MA20: | 386.80 | |
| MA50: | 394.49 | |
| MA100: | 386.00 | |
| MAexp7: | 385.73 | |
| MAexp20: | 387.37 | |
| MAexp50: | 389.14 | |
| MAexp100: | 387.62 | |
| Price / MA7: | +1.46% | |
| Price / MA20: | +0.66% | |
| Price / MA50: | -1.30% | |
| Price / MA100: | +0.87% | |
| Price / MAexp7: | +0.94% | |
| Price / MAexp20: | +0.51% | |
| Price / MAexp50: | +0.06% | |
| Price / MAexp100: | +0.45% |
About author
Online


Add a comment
Comments
0 comments on the analysis NASDAQ TELECOM INDEX - Daily