| Open: | - |
| Change: | - |
| Volume: | - |
| Low: | - |
| High: | - |
| High / Low range: | - |
| Type: | Futures |
| Ticker: | MGC1224 |
| ISIN: | MGCZ4 |
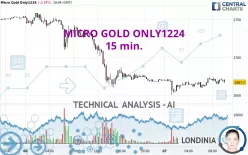
MICRO GOLD ONLY1224 - 15 min. - Technical analysis published on 11/07/2024 (GMT)
- 84
- 0
- 11/07/2024 - 10:14
Click here for a new analysis!
- Timeframe : 15 min.
- - Analysis generated on 11/07/2024 - 10:14
- Status : LEVEL MAINTAINED

Summary of the analysis
Additional analysis
Quotes
MICRO GOLD ONLY1224 rating 2,667.2 USD. On the day, this instrument lost -0.34% with the lowest point at 2,650.2 USD and the highest point at 2,674.5 USD. The deviation from the price is +0.64% for the low point and -0.27% for the high point.The Central Gaps scanner detects a bearish opening marking the presence of sellers ahead of buyers at the opening but not sufficiently marked to allow the price to register a quotation gap.
Bearish opening
Type : Bearish
Timeframe : Openning
Here is a more detailed summary of the historical variations registered by MICRO GOLD ONLY1224:
Near a new HIGH record (5 years)
Type : Bullish
Timeframe : Weekly
Near a new HIGH record (1 year)
Type : Bullish
Timeframe : Weekly
Near a new HIGH record (1st january)
Type : Bullish
Timeframe : Weekly
Near a new HIGH record (1 month)
Type : Bullish
Timeframe : Weekly
Abnormal volumes on MICRO GOLD ONLY1224 were detected by the Central Volumes scanner:
Abnormal volumes
Timeframe : 5 days
Abnormal volumes
Timeframe : 20 days
Abnormal volumes
Timeframe : 50 days
Technical
Technical analysis of this 15 min. chart of MICRO GOLD ONLY1224 indicates that the overall trend is bearish. 64.29% of the signals given by moving averages are bearish. Caution: the neutral signals currently given by short-term moving averages show us that the global trend is losing momentum. There is no crossing of moving average by the price or crossing of moving averages between themselves.
An assessment of technical indicators does not currently provide any relevant information to suggest whether the signal given by the technical indicators is more bullish or bearish.
But beware of excesses. The Central Indicators scanner currently detects this:
CCI indicator is overbought : over 100
Type : Neutral
Timeframe : 15 minutes
MACD indicator: bearish divergence
Type : Bearish
Timeframe : 15 minutes
Pivot points : price is under support 3
Type : Neutral
Timeframe : Weekly
The analysis of the price chart with Central Patterns scanners does not return any result.
There is also a Japanese candlestick pattern detected by Central Candlesticks that could mark the end of the current short-term trend:
White hanging man / hammer
Type : Neutral
Timeframe : 15 minutes
| S3 | S2 | S1 | Price | R1 | R2 | R3 | |
|---|---|---|---|---|---|---|---|
| ProTrendLines | 2,511.8 | 2,626.0 | 2,660.6 | 2,667.2 | 2,694.9 | 2,741.8 | 2,759.0 |
| Change (%) | -5.83% | -1.54% | -0.25% | - | +1.04% | +2.80% | +3.44% |
| Change | -155.4 | -41.2 | -6.6 | - | +27.7 | +74.6 | +91.8 |
| Level | Major | Minor | Intermediate | - | Major | Minor | Intermediate |
Pivot points can also be used to set your price objectives. Here is the price situation in relation to pivot points:
| Pivot points | S3 | S2 | S1 | PP | R1 | R2 | R3 |
|---|---|---|---|---|---|---|---|
| Standard | 2,540.4 | 2,600.5 | 2,638.4 | 2,698.5 | 2,736.4 | 2,796.5 | 2,834.4 |
| Camarilla | 2,649.4 | 2,658.3 | 2,667.3 | 2,676.3 | 2,685.3 | 2,694.3 | 2,703.3 |
| Woodie | 2,529.3 | 2,595.0 | 2,627.3 | 2,693.0 | 2,725.3 | 2,791.0 | 2,823.3 |
| Fibonacci | 2,600.5 | 2,637.9 | 2,661.1 | 2,698.5 | 2,735.9 | 2,759.1 | 2,796.5 |
| Pivot points | S3 | S2 | S1 | PP | R1 | R2 | R3 |
|---|---|---|---|---|---|---|---|
| Standard | 2,658.6 | 2,697.7 | 2,723.5 | 2,762.6 | 2,788.4 | 2,827.5 | 2,853.3 |
| Camarilla | 2,731.4 | 2,737.3 | 2,743.3 | 2,749.2 | 2,755.2 | 2,761.1 | 2,767.1 |
| Woodie | 2,651.9 | 2,694.4 | 2,716.8 | 2,759.3 | 2,781.7 | 2,824.2 | 2,846.6 |
| Fibonacci | 2,697.7 | 2,722.5 | 2,737.8 | 2,762.6 | 2,787.4 | 2,802.7 | 2,827.5 |
| Pivot points | S3 | S2 | S1 | PP | R1 | R2 | R3 |
|---|---|---|---|---|---|---|---|
| Standard | 2,462.6 | 2,540.9 | 2,645.1 | 2,723.4 | 2,827.6 | 2,905.9 | 3,010.1 |
| Camarilla | 2,699.0 | 2,715.7 | 2,732.5 | 2,749.2 | 2,765.9 | 2,782.7 | 2,799.4 |
| Woodie | 2,475.5 | 2,547.4 | 2,658.0 | 2,729.9 | 2,840.5 | 2,912.4 | 3,023.0 |
| Fibonacci | 2,540.9 | 2,610.7 | 2,653.7 | 2,723.4 | 2,793.2 | 2,836.2 | 2,905.9 |
Numerical data
The following is the status of technical indicators and moving averages registered at the time this technical analysis was created:
| RSI (14): | 52.40 | |
| MACD (12,26,9): | 0.9000 | |
| Directional Movement: | 4.7 | |
| AROON (14): | 28.6 | |
| DEMA (21): | 2,668.9 | |
| Parabolic SAR (0,02-0,02-0,2): | 2,664.6 | |
| Elder Ray (13): | 0.9 | |
| Super Trend (3,10): | 2,660.7 | |
| Zig ZAG (10): | 2,670.1 | |
| VORTEX (21): | 1.1000 | |
| Stochastique (14,3,5): | 75.30 | |
| TEMA (21): | 2,670.8 | |
| Williams %R (14): | -36.70 | |
| Chande Momentum Oscillator (20): | 5.8 | |
| Repulse (5,40,3): | 0.0000 | |
| ROCnROLL: | -1 | |
| TRIX (15,9): | 0.0000 | |
| Courbe Coppock: | 0.40 |
| MA7: | 2,734.2 | |
| MA20: | 2,728.0 | |
| MA50: | 2,658.3 | |
| MA100: | 2,560.4 | |
| MAexp7: | 2,668.7 | |
| MAexp20: | 2,667.8 | |
| MAexp50: | 2,669.9 | |
| MAexp100: | 2,681.8 | |
| Price / MA7: | -2.45% | |
| Price / MA20: | -2.23% | |
| Price / MA50: | +0.33% | |
| Price / MA100: | +4.17% | |
| Price / MAexp7: | -0.06% | |
| Price / MAexp20: | -0.02% | |
| Price / MAexp50: | -0.10% | |
| Price / MAexp100: | -0.54% |
About author

Online


Add a comment
Comments
0 comments on the analysis MICRO GOLD ONLY1224 - 15 min.