NEW YORK COMMUNITY BANCORP - Daily - Technical analysis published on 10/26/2022 (GMT)
- 132
- 0
Click here for a new analysis!
- Timeframe : Daily
- - Analysis generated on
- Status : INVALID

Summary of the analysis
Additional analysis
Quotes
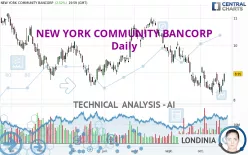
The NEW YORK COMMUNITY BANCORP rating is 8.95 USD. On the day, this instrument gained +2.52% with the lowest point at 8.64 USD and the highest point at 8.97 USD. The deviation from the price is +3.59% for the low point and -0.22% for the high point.A bearish opening was detected by the Central Gaps scanner. Sellers are trying to impose a bearish trend in the very short term.
Bearish opening
Type : Bearish
Timeframe : Openning
So that you have an overall view of the price change, here is a table showing the variations over several periods:
Near a new HIGH record (1 month)
Type : Bullish
Timeframe : Weekly
Technical
Technical analysis of this Daily chart of NEW YORK COMMUNITY BANCORP indicates that the overall trend is bearish. The signals given by moving averages are 71.43% bearish. This bearish trend could slow down given the neutral signals currently being given by short-term moving averages. An assessment of moving averages reveals several bullish signals that could impact this trend:
Bullish trend reversal : Moving Average 20
Type : Bullish
Timeframe : Daily
Bullish trend reversal : adaptative moving average 20
Type : Bullish
Timeframe : Daily
Bullish price crossover with adaptative moving average 20
Type : Bullish
Timeframe : Daily
The probability of a further increase are moderate given the direction of the technical indicators.
Caution: the Central Indicators scanner currently detects an excess:
Williams %R indicator is overbought : over -20
Type : Neutral
Timeframe : Daily
Pivot points : price is over resistance 1
Type : Neutral
Timeframe : Weekly
Pivot points : price is over resistance 2
Type : Neutral
Timeframe : Daily
RSI indicator is back over 50
Type : Bullish
Timeframe : Daily
Momentum indicator is back over 0
Type : Bullish
Timeframe : Daily
Central Patterns, the scanner specializing in chart patterns, did not identify any signals.
The Central Candlesticks scanner, specialised in Japanese candlesticks, did not identify any signals.
| S3 | S2 | S1 | Price | R1 | R2 | R3 | |
|---|---|---|---|---|---|---|---|
| ProTrendLines | 6.97 | 7.89 | 8.73 | 8.95 | 9.40 | 10.09 | 10.96 |
| Change (%) | -22.12% | -11.84% | -2.46% | - | +5.03% | +12.74% | +22.46% |
| Change | -1.98 | -1.06 | -0.22 | - | +0.45 | +1.14 | +2.01 |
| Level | Major | Intermediate | Major | - | Intermediate | Major | Major |
Pivot points can also be used to set your price objectives. Here is the price situation in relation to pivot points:
| Pivot points | S3 | S2 | S1 | PP | R1 | R2 | R3 |
|---|---|---|---|---|---|---|---|
| Standard | 8.41 | 8.52 | 8.74 | 8.85 | 9.07 | 9.18 | 9.40 |
| Camarilla | 8.86 | 8.89 | 8.92 | 8.95 | 8.98 | 9.01 | 9.04 |
| Woodie | 8.46 | 8.55 | 8.79 | 8.88 | 9.12 | 9.21 | 9.45 |
| Fibonacci | 8.52 | 8.65 | 8.73 | 8.85 | 8.98 | 9.06 | 9.18 |
| Pivot points | S3 | S2 | S1 | PP | R1 | R2 | R3 |
|---|---|---|---|---|---|---|---|
| Standard | 7.36 | 7.80 | 8.14 | 8.58 | 8.92 | 9.36 | 9.70 |
| Camarilla | 8.28 | 8.35 | 8.42 | 8.49 | 8.56 | 8.63 | 8.71 |
| Woodie | 7.32 | 7.78 | 8.10 | 8.56 | 8.88 | 9.34 | 9.66 |
| Fibonacci | 7.80 | 8.10 | 8.28 | 8.58 | 8.88 | 9.06 | 9.36 |
| Pivot points | S3 | S2 | S1 | PP | R1 | R2 | R3 |
|---|---|---|---|---|---|---|---|
| Standard | 6.33 | 7.41 | 7.97 | 9.05 | 9.61 | 10.69 | 11.25 |
| Camarilla | 8.08 | 8.23 | 8.38 | 8.53 | 8.68 | 8.83 | 8.98 |
| Woodie | 6.07 | 7.28 | 7.71 | 8.92 | 9.35 | 10.56 | 10.99 |
| Fibonacci | 7.41 | 8.04 | 8.42 | 9.05 | 9.68 | 10.06 | 10.69 |
Numerical data
The following is the status of the technical indicators and moving averages at the time of publication of this technical analysis:
| RSI (14): | 52.27 | |
| MACD (12,26,9): | -0.1700 | |
| Directional Movement: | 5.17 | |
| AROON (14): | -42.86 | |
| DEMA (21): | 8.48 | |
| Parabolic SAR (0,02-0,02-0,2): | 8.25 | |
| Elder Ray (13): | 0.14 | |
| Super Trend (3,10): | 9.30 | |
| Zig ZAG (10): | 8.95 | |
| VORTEX (21): | 0.9100 | |
| Stochastique (14,3,5): | 59.99 | |
| TEMA (21): | 8.54 | |
| Williams %R (14): | -13.33 | |
| Chande Momentum Oscillator (20): | 0.50 | |
| Repulse (5,40,3): | 5.3900 | |
| ROCnROLL: | -1 | |
| TRIX (15,9): | -0.4000 | |
| Courbe Coppock: | 2.96 |
| MA7: | 8.64 | |
| MA20: | 8.66 | |
| MA50: | 9.36 | |
| MA100: | 9.40 | |
| MAexp7: | 8.67 | |
| MAexp20: | 8.75 | |
| MAexp50: | 9.11 | |
| MAexp100: | 9.42 | |
| Price / MA7: | +3.59% | |
| Price / MA20: | +3.35% | |
| Price / MA50: | -4.38% | |
| Price / MA100: | -4.79% | |
| Price / MAexp7: | +3.23% | |
| Price / MAexp20: | +2.29% | |
| Price / MAexp50: | -1.76% | |
| Price / MAexp100: | -4.99% |
News
The last news published on NEW YORK COMMUNITY BANCORP at the time of the generation of this analysis was as follows:
- Investor Network: New York Community Bancorp, Inc. to Host Earnings Call
-
 New York Community Bcp
- New York Community Bancorp, Inc. And Astoria Financial Corporation Announce The Termination Of Their Definitive Merger Agreement Effective January 1, 2017
-
New York Community Bcp
-
New York Community Bancorp Eyes Growth Through Acquisitions
About author

Online


Add a comment
Comments
0 comments on the analysis NEW YORK COMMUNITY BANCORP - Daily