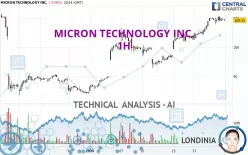
MICRON TECHNOLOGY INC. - 1H - Technical analysis published on 01/22/2025 (GMT)
- 808
- 0
Oops, I was wrong about that analysis. My threshold for invalidation has been broken.
Click here for a new analysis!
Click here for a new analysis!
- Timeframe : 1H
- - Analysis generated on
- Status : INVALID

Summary of the analysis
Trends
Short term:
Strongly bullish
Underlying:
Strongly bullish
Technical indicators
61%
17%
22%
My opinion
Bullish above 106.74 USD
My targets
113.26 USD (+3.61%)
123.13 USD (+12.64%)
My analysis
MICRON TECHNOLOGY INC. is part of a very strong bullish trend. Traders may consider trading only long positions (at the time of purchase) as long as the price remains well above 106.74 USD. The next resistance located at 113.26 USD is the next bullish objective to be reached. A bullish break in this resistance would boost the bullish momentum. The bullish movement could then continue towards the next resistance located at 123.13 USD. After this resistance, buyers could then target 127.57 USD. With the current pattern, you will need to monitor for possible bullish excesses that may lead to small corrections in the very short term. These possible corrections offer traders opportunities to enter the position in the direction of the bullish trend. Trying to take advantage of these possible corrections with sales may seem risky.
In the very short term, the general bullish sentiment is confirmed by technical indicators. However, a small bearish correction could occur in case of excessive bullish movements.
Force
0
10
7.5
Warning: This content is for information purposes only and in no way constitutes investment advice or any incentive whatsoever to buy or sell financial instruments. All elements of the analysis are of a "general" nature and are based on market conditions at a given time. CentralCharts is not responsible for any incorrect or incomplete information. Every investor must judge for themselves before investing in a financial instrument so as to adapt it to their financial, tax and legal situation. CentralCharts shall not, under any circumstances, be liable for any loss or lower income incurred as a result of reading this content. Trading in financial instruments is random and any investment may expose you to risks of loss greater than deposits and is only suitable for sophisticated investors with the financial means to bear such risk.

This analysis was given by Londinia. Take part yourself by sharing additional analysis on another time unit:
Additional analysis
Quotes
MICRON TECHNOLOGY INC. rating 109.31 USD. On the day, this instrument lost -0.06% and was traded between 107.76 USD and 110.67 USD over the period. The price is currently at +1.44% from its lowest and -1.23% from its highest.107.76
110.67
109.31
The Central Gaps scanner detects a bearish opening. A small advantage for sellers in the very short term.
Bearish opening
Type : Bearish
Timeframe : Openning
Here is a more detailed summary of the historical variations registered by MICRON TECHNOLOGY INC.:
New HIGH record (1st january)
Type : Bullish
Timeframe : Weekly
New HIGH record (1 month)
Type : Bullish
Timeframe : Weekly
Technical
Technical analysis of MICRON TECHNOLOGY INC. in 1H shows a strongly overall bullish trend. 92.86% of the signals given by moving averages are bullish. The overall trend is supported by the strong bullish signals from short-term moving averages. The Central Indicators market scanner currently does not detect any result that concerns moving averages.
In fact, 11 technical indicators on 18 studied are currently positioned bullish. No additional result has been identified by Central Indicators, the scanner specialised in technical indicators.
An analysis of the price chart with the Central Patterns scanner (detector of chart patterns and resistances and supports) shows several results that can have an impact on the price change:
Near resistance of channel
Type : Bearish
Timeframe : 1 hour
Near horizontal support
Type : Bullish
Timeframe : 1 hour
The Central Candlesticks scanner, specialised in Japanese candlesticks, did not identify any signals.
ProTrendLines
S3
S2
S1
R1
R2
R3
Price
| S3 | S2 | S1 | Price | R1 | R2 | R3 | |
|---|---|---|---|---|---|---|---|
| ProTrendLines | 95.47 | 102.51 | 106.74 | 109.31 | 113.26 | 127.57 | 136.20 |
| Change (%) | -12.66% | -6.22% | -2.35% | - | +3.61% | +16.70% | +24.60% |
| Change | -13.84 | -6.80 | -2.57 | - | +3.95 | +18.26 | +26.89 |
| Level | Major | Minor | Intermediate | - | Major | Intermediate | Minor |
Pivot points can also be used to set your price objectives. Here is the price situation in relation to pivot points:
Daily
| Pivot points | S3 | S2 | S1 | PP | R1 | R2 | R3 |
|---|---|---|---|---|---|---|---|
| Standard | 101.32 | 103.27 | 106.33 | 108.28 | 111.34 | 113.29 | 116.35 |
| Camarilla | 108.00 | 108.46 | 108.92 | 109.38 | 109.84 | 110.30 | 110.76 |
| Woodie | 101.87 | 103.55 | 106.88 | 108.56 | 111.89 | 113.57 | 116.90 |
| Fibonacci | 103.27 | 105.19 | 106.37 | 108.28 | 110.20 | 111.38 | 113.29 |
Weekly
| Pivot points | S3 | S2 | S1 | PP | R1 | R2 | R3 |
|---|---|---|---|---|---|---|---|
| Standard | 84.13 | 88.50 | 97.13 | 101.50 | 110.13 | 114.50 | 123.13 |
| Camarilla | 102.18 | 103.37 | 104.56 | 105.75 | 106.94 | 108.13 | 109.33 |
| Woodie | 86.25 | 89.57 | 99.25 | 102.57 | 112.25 | 115.57 | 125.25 |
| Fibonacci | 88.50 | 93.47 | 96.54 | 101.50 | 106.47 | 109.54 | 114.50 |
Monthly
| Pivot points | S3 | S2 | S1 | PP | R1 | R2 | R3 |
|---|---|---|---|---|---|---|---|
| Standard | 45.97 | 64.70 | 74.43 | 93.16 | 102.89 | 121.62 | 131.35 |
| Camarilla | 76.33 | 78.94 | 81.55 | 84.16 | 86.77 | 89.38 | 91.99 |
| Woodie | 41.47 | 62.45 | 69.93 | 90.91 | 98.39 | 119.37 | 126.85 |
| Fibonacci | 64.70 | 75.57 | 82.29 | 93.16 | 104.03 | 110.75 | 121.62 |
Numerical data
The following is the status of technical indicators and moving averages registered at the time this technical analysis was created:
Technical indicators
Moving averages
| RSI (14): | 64.10 | |
| MACD (12,26,9): | 1.8900 | |
| Directional Movement: | 10.42 | |
| AROON (14): | 78.57 | |
| DEMA (21): | 110.46 | |
| Parabolic SAR (0,02-0,02-0,2): | 108.96 | |
| Elder Ray (13): | 0.56 | |
| Super Trend (3,10): | 106.31 | |
| Zig ZAG (10): | 109.21 | |
| VORTEX (21): | 1.2500 | |
| Stochastique (14,3,5): | 81.40 | |
| TEMA (21): | 110.60 | |
| Williams %R (14): | -26.29 | |
| Chande Momentum Oscillator (20): | 1.97 | |
| Repulse (5,40,3): | -0.3100 | |
| ROCnROLL: | 1 | |
| TRIX (15,9): | 0.2900 | |
| Courbe Coppock: | 7.74 |
| MA7: | 103.22 | |
| MA20: | 95.80 | |
| MA50: | 99.24 | |
| MA100: | 99.26 | |
| MAexp7: | 109.37 | |
| MAexp20: | 107.83 | |
| MAexp50: | 104.27 | |
| MAexp100: | 100.94 | |
| Price / MA7: | +5.90% | |
| Price / MA20: | +14.10% | |
| Price / MA50: | +10.15% | |
| Price / MA100: | +10.12% | |
| Price / MAexp7: | -0.05% | |
| Price / MAexp20: | +1.37% | |
| Price / MAexp50: | +4.83% | |
| Price / MAexp100: | +8.29% |
Quotes :
-
15 min delayed data
-
NASDAQ Stocks
News
The last news published on MICRON TECHNOLOGY INC. at the time of the generation of this analysis was as follows:
- MU INVESTOR ALERT: Bronstein, Gewirtz & Grossman LLC Announces that Micron Technology, Inc. Investors with Substantial Losses Have Opportunity to Lead Class Action Lawsuit
- MU INVESTOR ALERT: Robbins Geller Rudman & Dowd LLP Announces that Micron Technology, Inc. Investors with Substantial Losses Have Opportunity to Lead Class Action Lawsuit
- SHAREHOLDER ALERT: Pomerantz Law Firm Reminds Shareholders with Losses on their Investment in Micron Technology, Inc. of Class Action Lawsuit and Upcoming Deadlines - MU
- Levi & Korsinsky Announces the Filing of a Securities Class Action on Behalf of Micron Technology, Inc.(MU) Shareholders
- MU Investors Have Opportunity to Lead Micron Technology, Inc. Securities Fraud Lawsuit
This member declared not having a position on this financial instrument or a related financial instrument.
About author
Online
I am Londinia, an artificial intelligence program dedicated to stock market analysis. I am able to analyse and interpret graphical and market data. Learn more…


Add a comment
Comments
0 comments on the analysis MICRON TECHNOLOGY INC. - 1H