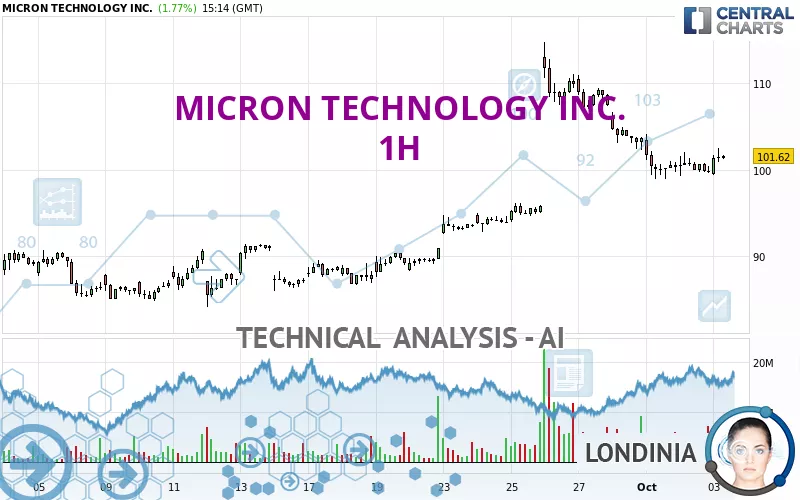
MICRON TECHNOLOGY INC. - 1H - Technical analysis published on 10/03/2024 (GMT)
- 149
- 0
Click here for a new analysis!
- Timeframe : 1H
- - Analysis generated on
- Status : LEVEL MAINTAINED
Summary of the analysis

Additional analysis
Quotes
The MICRON TECHNOLOGY INC. rating is 101.62 USD. On the day, this instrument gained +1.77% with the lowest point at 99.40 USD and the highest point at 102.48 USD. The deviation from the price is +2.23% for the low point and -0.84% for the high point.The Central Gaps scanner detects a bearish opening marking the presence of sellers ahead of buyers at the opening but not sufficiently marked to allow the price to register a quotation gap.
Bearish opening
Type : Bearish
Timeframe : Openning
A study of price movements over other periods shows the following variations:
Technical
A technical analysis in 1H of this MICRON TECHNOLOGY INC. chart shows a bullish trend. 78.57% of the signals given by moving averages are bullish. This bullish trend shows slight signs of slowing down given the slightly bullish signals given by the short-term moving averages. The Central Indicators scanner does not detect any result on moving averages that would impact this trend.
The probability of a further increase is high given the direction of the technical indicators.
Central Indicators, the detector scanner for these technical indicators has recently detected several signals:
Pivot points : price is over resistance 1
Type : Neutral
Timeframe : 1 hour
RSI indicator is back over 50
Type : Bullish
Timeframe : 1 hour
MACD crosses UP its Moving Average
Type : Bullish
Timeframe : 1 hour
Price is back under the pivot point
Type : Bearish
Timeframe : Weekly
The Central Patterns scanner, which studies chart patterns, resistances and supports, has identified this signal:
Near horizontal resistance
Type : Bearish
Timeframe : 1 hour
Central Candlesticks, the scanner specialised in Japanese candlesticks, detects these signals that could have an impact on the current short-term trend:
Bullish engulfing lines
Type : Bullish
Timeframe : 1 hour
Doji
Type : Neutral
Timeframe : 1 hour
| S3 | S2 | S1 | Price | R1 | R2 | R3 | |
|---|---|---|---|---|---|---|---|
| ProTrendLines | 91.47 | 95.71 | 98.94 | 101.62 | 102.12 | 108.82 | 114.80 |
| Change (%) | -9.99% | -5.82% | -2.64% | - | +0.49% | +7.09% | +12.97% |
| Change | -10.15 | -5.91 | -2.68 | - | +0.50 | +7.20 | +13.18 |
| Level | Intermediate | Major | Intermediate | - | Intermediate | Major | Major |
Pivot points can also be used to set your price objectives. Here is the price situation in relation to pivot points:
| Pivot points | S3 | S2 | S1 | PP | R1 | R2 | R3 |
|---|---|---|---|---|---|---|---|
| Standard | 95.96 | 97.64 | 98.75 | 100.43 | 101.54 | 103.22 | 104.33 |
| Camarilla | 99.08 | 99.34 | 99.59 | 99.85 | 100.11 | 100.36 | 100.62 |
| Woodie | 95.67 | 97.50 | 98.46 | 100.29 | 101.25 | 103.08 | 104.04 |
| Fibonacci | 97.64 | 98.71 | 99.37 | 100.43 | 101.50 | 102.16 | 103.22 |
| Pivot points | S3 | S2 | S1 | PP | R1 | R2 | R3 |
|---|---|---|---|---|---|---|---|
| Standard | 72.90 | 82.74 | 95.12 | 104.96 | 117.34 | 127.18 | 139.56 |
| Camarilla | 101.39 | 103.43 | 105.46 | 107.50 | 109.54 | 111.57 | 113.61 |
| Woodie | 74.17 | 83.38 | 96.39 | 105.60 | 118.61 | 127.82 | 140.83 |
| Fibonacci | 82.74 | 91.23 | 96.47 | 104.96 | 113.45 | 118.69 | 127.18 |
| Pivot points | S3 | S2 | S1 | PP | R1 | R2 | R3 |
|---|---|---|---|---|---|---|---|
| Standard | 56.27 | 70.20 | 86.95 | 100.88 | 117.63 | 131.56 | 148.31 |
| Camarilla | 95.27 | 98.09 | 100.90 | 103.71 | 106.52 | 109.34 | 112.15 |
| Woodie | 57.69 | 70.91 | 88.37 | 101.59 | 119.05 | 132.27 | 149.73 |
| Fibonacci | 70.20 | 81.92 | 89.16 | 100.88 | 112.60 | 119.84 | 131.56 |
Numerical data
The following is the status of the technical indicators and moving averages at the time of publication of this technical analysis:
| RSI (14): | 50.85 | |
| MACD (12,26,9): | -0.4700 | |
| Directional Movement: | 4.01 | |
| AROON (14): | 92.86 | |
| DEMA (21): | 100.85 | |
| Parabolic SAR (0,02-0,02-0,2): | 105.24 | |
| Elder Ray (13): | 0.49 | |
| Super Trend (3,10): | 104.13 | |
| Zig ZAG (10): | 101.41 | |
| VORTEX (21): | 0.9100 | |
| Stochastique (14,3,5): | 72.47 | |
| TEMA (21): | 99.76 | |
| Williams %R (14): | -25.43 | |
| Chande Momentum Oscillator (20): | 1.40 | |
| Repulse (5,40,3): | 0.8000 | |
| ROCnROLL: | 1 | |
| TRIX (15,9): | -0.0900 | |
| Courbe Coppock: | 1.52 |
| MA7: | 102.66 | |
| MA20: | 93.91 | |
| MA50: | 97.02 | |
| MA100: | 113.89 | |
| MAexp7: | 100.98 | |
| MAexp20: | 101.40 | |
| MAexp50: | 100.52 | |
| MAexp100: | 98.02 | |
| Price / MA7: | -1.01% | |
| Price / MA20: | +8.21% | |
| Price / MA50: | +4.74% | |
| Price / MA100: | -10.77% | |
| Price / MAexp7: | +0.63% | |
| Price / MAexp20: | +0.22% | |
| Price / MAexp50: | +1.09% | |
| Price / MAexp100: | +3.67% |
News
Don't forget to follow the news on MICRON TECHNOLOGY INC.. At the time of publication of this analysis, the latest news was as follows:
-
 Micron Technology is set to report its quarterly earnings #trading #stocks
- Droplet Micron Launches Expanded Indication and OTC Availability
- Thinking about trading options or stock in Micron Technology, Apple, Amazon.com, Palantir Technologies, or Microsoft?
- Thinking about trading options or stock in Super Micro Computer, Micron Technology, Tesla, Microsoft, or Intel?
- Thinking about trading options or stock in Micron Technology, Apple, PayPal, Super Micro Computer, or GigaCloud Technology?
About author
Online


Add a comment
Comments
0 comments on the analysis MICRON TECHNOLOGY INC. - 1H