MICRON TECHNOLOGY INC. - Daily - Technical analysis published on 10/01/2024 (GMT)
- 121
- 0
Click here for a new analysis!
- Timeframe : Daily
- - Analysis generated on
- Status : TARGET REACHED
Summary of the analysis

Additional analysis
Quotes
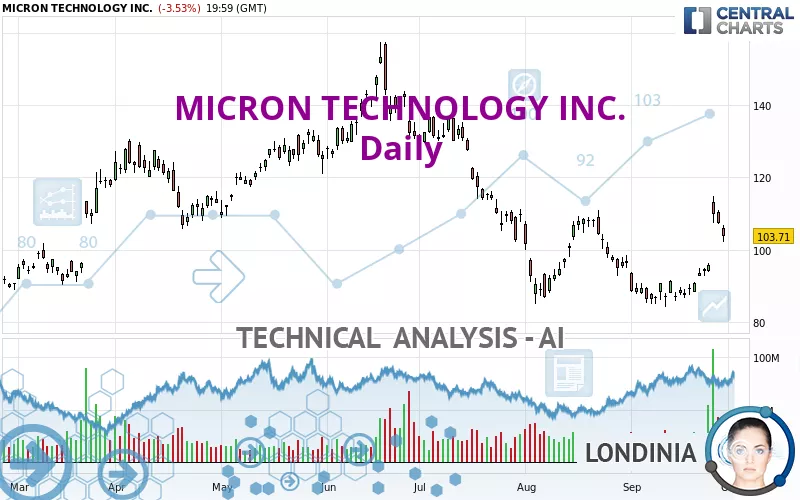
The MICRON TECHNOLOGY INC. rating is 103.71 USD. The price registered a decrease of -3.53% on the session with the lowest point at 102.26 USD and the highest point at 106.75 USD. The deviation from the price is +1.42% for the low point and -2.85% for the high point.A bearish gap was detected at the opening by the Central Gaps scanner. There are a lot of sellers and they have the upper hand in the very short term.
Opening Gap DOWN
Type : Bearish
Timeframe : Openning
So that you have an overall view of the price change, here is a table showing the variations over several periods:
Abnormal volumes
Timeframe : 5 days
Technical
Technical analysis of this Daily chart of MICRON TECHNOLOGY INC. indicates that the overall trend is slightly bearish. 57.14% of the signals given by moving averages are bearish. Caution: the strong bullish signals currently being given by short-term moving averages indicate that this slightly bearish trend could quickly be reversed. There is no crossing of moving average by the price or crossing of moving averages between themselves.
Technical indicators are strongly bullish, suggesting that the price increase should continue.
Caution: the Central Indicators scanner currently detects an excess:
CCI indicator is overbought : over 100
Type : Neutral
Timeframe : Daily
Previous candle closed over Bollinger bands
Type : Neutral
Timeframe : Daily
Pivot points : price is under support 3
Type : Neutral
Timeframe : Daily
Price is back under the pivot point
Type : Bearish
Timeframe : Weekly
An analysis of the price chart with the Central Patterns scanner (detector of chart patterns and resistances and supports) shows several results that can have an impact on the price change:
Near horizontal resistance
Type : Bearish
Timeframe : Daily
Near resistance of channel
Type : Bearish
Timeframe : Daily
For a small setback in the very short term, the Central Candlesticks scanner currently notes the presence of this bearish pattern in Japanese candlesticks:
Downside gap
Type : Bearish
Timeframe : Daily
| S3 | S2 | S1 | Price | R1 | R2 | R3 | |
|---|---|---|---|---|---|---|---|
| ProTrendLines | 79.25 | 86.80 | 95.71 | 103.71 | 108.82 | 127.89 | 136.54 |
| Change (%) | -23.58% | -16.31% | -7.71% | - | +4.93% | +23.32% | +31.66% |
| Change | -24.46 | -16.91 | -8.00 | - | +5.11 | +24.18 | +32.83 |
| Level | Minor | Intermediate | Major | - | Major | Intermediate | Minor |
Attention could also be paid to pivot points to set price objectives:
| Pivot points | S3 | S2 | S1 | PP | R1 | R2 | R3 |
|---|---|---|---|---|---|---|---|
| Standard | 97.24 | 99.75 | 101.73 | 104.24 | 106.22 | 108.73 | 110.71 |
| Camarilla | 102.48 | 102.89 | 103.30 | 103.71 | 104.12 | 104.53 | 104.95 |
| Woodie | 96.98 | 99.62 | 101.47 | 104.11 | 105.96 | 108.60 | 110.45 |
| Fibonacci | 99.75 | 101.47 | 102.53 | 104.24 | 105.96 | 107.02 | 108.73 |
| Pivot points | S3 | S2 | S1 | PP | R1 | R2 | R3 |
|---|---|---|---|---|---|---|---|
| Standard | 57.68 | 71.29 | 83.77 | 97.38 | 109.86 | 123.47 | 135.95 |
| Camarilla | 89.07 | 91.46 | 93.85 | 96.24 | 98.63 | 101.02 | 103.42 |
| Woodie | 57.11 | 71.01 | 83.20 | 97.10 | 109.29 | 123.19 | 135.38 |
| Fibonacci | 71.29 | 81.26 | 87.42 | 97.38 | 107.35 | 113.51 | 123.47 |
Numerical data
The following is the status of the technical indicators and moving averages at the time of publication of this technical analysis:
| RSI (14): | 58.86 | |
| MACD (12,26,9): | 1.1300 | |
| Directional Movement: | 18.73 | |
| AROON (14): | 71.42 | |
| DEMA (21): | 96.22 | |
| Parabolic SAR (0,02-0,02-0,2): | 91.99 | |
| Elder Ray (13): | 7.23 | |
| Super Trend (3,10): | 95.88 | |
| Zig ZAG (10): | 103.71 | |
| VORTEX (21): | 0.8600 | |
| Stochastique (14,3,5): | 74.67 | |
| TEMA (21): | 101.07 | |
| Williams %R (14): | -36.15 | |
| Chande Momentum Oscillator (20): | 16.50 | |
| Repulse (5,40,3): | -5.5800 | |
| ROCnROLL: | 1 | |
| TRIX (15,9): | -0.2600 | |
| Courbe Coppock: | 24.64 |
| MA7: | 99.33 | |
| MA20: | 92.18 | |
| MA50: | 97.78 | |
| MA100: | 114.46 | |
| MAexp7: | 100.51 | |
| MAexp20: | 96.25 | |
| MAexp50: | 100.45 | |
| MAexp100: | 105.16 | |
| Price / MA7: | +4.41% | |
| Price / MA20: | +12.51% | |
| Price / MA50: | +6.06% | |
| Price / MA100: | -9.39% | |
| Price / MAexp7: | +3.18% | |
| Price / MAexp20: | +7.75% | |
| Price / MAexp50: | +3.25% | |
| Price / MAexp100: | -1.38% |
News
Don't forget to follow the news on MICRON TECHNOLOGY INC.. At the time of publication of this analysis, the latest news was as follows:
-
 Micron Technology is set to report its quarterly earnings #trading #stocks
- Droplet Micron Launches Expanded Indication and OTC Availability
- Thinking about trading options or stock in Micron Technology, Apple, Amazon.com, Palantir Technologies, or Microsoft?
- Thinking about trading options or stock in Super Micro Computer, Micron Technology, Tesla, Microsoft, or Intel?
- Thinking about trading options or stock in Micron Technology, Apple, PayPal, Super Micro Computer, or GigaCloud Technology?
About author

Online


Add a comment
Comments
0 comments on the analysis MICRON TECHNOLOGY INC. - Daily