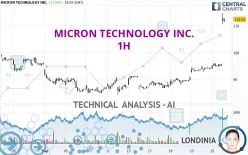
MICRON TECHNOLOGY INC. - 1H - Technical analysis published on 09/26/2024 (GMT)
- 139
- 0
Click here for a new analysis!
- Timeframe : 1H
- - Analysis generated on
- Status : INVALID

Summary of the analysis

Additional analysis
Quotes
The MICRON TECHNOLOGY INC. rating is 112.53 USD. On the day, this instrument gained +17.50% and was traded between 110.58 USD and 114.80 USD over the period. The price is currently at +1.76% from its lowest and -1.98% from its highest.A bullish gap was detected at the opening by the Central Gaps scanner. There are a lot of buyers and they have the upper hand in the very short term.
Opening Gap UP
Type : Bullish
Timeframe : Openning
So that you have an overall view of the price change, here is a table showing the variations over several periods:
New HIGH record (1 month)
Type : Bullish
Timeframe : Weekly
Technical
Technical analysis of MICRON TECHNOLOGY INC. in 1H shows a strongly overall bullish trend. 92.86% of the signals given by moving averages are bullish. The overall trend is supported by the strong bullish signals from short-term moving averages. There is no crossing of moving average by the price or crossing of moving averages between themselves.
Technical indicators are strongly bullish, suggesting that the price increase should continue.
Caution: the Central Indicators scanner currently detects an excess:
RSI indicator is overbought : over 90
Type : Neutral
Timeframe : 1 hour
CCI indicator is overbought : over 100
Type : Neutral
Timeframe : 1 hour
Previous candle closed over Bollinger bands
Type : Neutral
Timeframe : 1 hour
Williams %R indicator is overbought : over -20
Type : Neutral
Timeframe : 1 hour
Pivot points : price is over resistance 3
Type : Neutral
Timeframe : 1 hour
Pivot points : price is over resistance 3
Type : Neutral
Timeframe : Weekly
The Central Patterns scanner, which studies chart patterns, resistances and supports, has identified this signal:
Resistance of channel is broken
Type : Bullish
Timeframe : 1 hour
No result was found by the Central Candlesticks scanner on Japanese candlesticks.
| S3 | S2 | S1 | Price | R1 | R2 | |
|---|---|---|---|---|---|---|
| ProTrendLines | 98.41 | 106.67 | 111.00 | 112.53 | 127.89 | 153.31 |
| Change (%) | -12.55% | -5.21% | -1.36% | - | +13.65% | +36.24% |
| Change | -14.12 | -5.86 | -1.53 | - | +15.36 | +40.78 |
| Level | Minor | Major | Intermediate | - | Intermediate | Major |
Attention could also be paid to pivot points to set price objectives:
| Pivot points | S3 | S2 | S1 | PP | R1 | R2 | R3 |
|---|---|---|---|---|---|---|---|
| Standard | 92.16 | 93.04 | 94.41 | 95.29 | 96.66 | 97.54 | 98.91 |
| Camarilla | 95.15 | 95.36 | 95.56 | 95.77 | 95.98 | 96.18 | 96.39 |
| Woodie | 92.40 | 93.16 | 94.65 | 95.41 | 96.90 | 97.66 | 99.15 |
| Fibonacci | 93.04 | 93.90 | 94.43 | 95.29 | 96.15 | 96.68 | 97.54 |
| Pivot points | S3 | S2 | S1 | PP | R1 | R2 | R3 |
|---|---|---|---|---|---|---|---|
| Standard | 82.51 | 84.21 | 87.56 | 89.26 | 92.61 | 94.31 | 97.66 |
| Camarilla | 89.51 | 89.97 | 90.44 | 90.90 | 91.36 | 91.83 | 92.29 |
| Woodie | 83.33 | 84.62 | 88.38 | 89.67 | 93.43 | 94.72 | 98.48 |
| Fibonacci | 84.21 | 86.14 | 87.33 | 89.26 | 91.19 | 92.38 | 94.31 |
| Pivot points | S3 | S2 | S1 | PP | R1 | R2 | R3 |
|---|---|---|---|---|---|---|---|
| Standard | 57.68 | 71.29 | 83.77 | 97.38 | 109.86 | 123.47 | 135.95 |
| Camarilla | 89.07 | 91.46 | 93.85 | 96.24 | 98.63 | 101.02 | 103.42 |
| Woodie | 57.11 | 71.01 | 83.20 | 97.10 | 109.29 | 123.19 | 135.38 |
| Fibonacci | 71.29 | 81.26 | 87.42 | 97.38 | 107.35 | 113.51 | 123.47 |
Numerical data
The following is the status of technical indicators and moving averages registered at the time this technical analysis was created:
| RSI (14): | 69.46 | |
| MACD (12,26,9): | 1.2600 | |
| Directional Movement: | 18.54 | |
| AROON (14): | 57.14 | |
| DEMA (21): | 95.76 | |
| Parabolic SAR (0,02-0,02-0,2): | 96.12 | |
| Elder Ray (13): | 0.80 | |
| Super Trend (3,10): | 92.79 | |
| Zig ZAG (10): | 95.77 | |
| VORTEX (21): | 1.1700 | |
| Stochastique (14,3,5): | 79.53 | |
| TEMA (21): | 95.99 | |
| Williams %R (14): | -11.99 | |
| Chande Momentum Oscillator (20): | 2.02 | |
| Repulse (5,40,3): | 0.8400 | |
| ROCnROLL: | 1 | |
| TRIX (15,9): | 0.2100 | |
| Courbe Coppock: | 3.82 |
| MA7: | 91.37 | |
| MA20: | 90.46 | |
| MA50: | 98.38 | |
| MA100: | 114.78 | |
| MAexp7: | 95.19 | |
| MAexp20: | 94.05 | |
| MAexp50: | 92.06 | |
| MAexp100: | 91.38 | |
| Price / MA7: | +23.16% | |
| Price / MA20: | +24.40% | |
| Price / MA50: | +14.38% | |
| Price / MA100: | -1.96% | |
| Price / MAexp7: | +18.20% | |
| Price / MAexp20: | +19.63% | |
| Price / MAexp50: | +22.21% | |
| Price / MAexp100: | +23.12% |
News
The latest news and videos published on MICRON TECHNOLOGY INC. at the time of the analysis were as follows:
-
 Micron Technology is set to report its quarterly earnings #trading #stocks
- Droplet Micron Launches Expanded Indication and OTC Availability
- Thinking about trading options or stock in Micron Technology, Apple, Amazon.com, Palantir Technologies, or Microsoft?
- Thinking about trading options or stock in Super Micro Computer, Micron Technology, Tesla, Microsoft, or Intel?
- Thinking about trading options or stock in Micron Technology, Apple, PayPal, Super Micro Computer, or GigaCloud Technology?
About author
Online


Add a comment
Comments
0 comments on the analysis MICRON TECHNOLOGY INC. - 1H