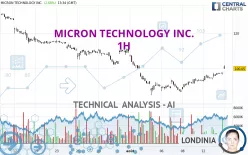
MICRON TECHNOLOGY INC. - 1H - Technical analysis published on 08/14/2024 (GMT)
- 130
- 0
Click here for a new analysis!
- Timeframe : 1H
- - Analysis generated on
- Status : TARGET REACHED

Summary of the analysis

Additional analysis
Quotes
The MICRON TECHNOLOGY INC. rating is 100.07 USD. On the day, this instrument gained +2.70% and was between 99.85 USD and 101.95 USD. This implies that the price is at +0.22% from its lowest and at -1.84% from its highest.The Central Gaps scanner detects the formation of a bullish gap marking the strong presence of buyers against sellers at the opening. This formed a quotation gap.
Opening Gap UP
Type : Bullish
Timeframe : Openning
A study of price movements over other periods shows the following variations:
Technical
A technical analysis in 1H of this MICRON TECHNOLOGY INC. chart shows a slightly bullish trend. 57.14% of the signals given by moving averages are bullish. This slightly bullish trend could be reinforced by the strong bullish signals given by short-term moving averages. The Central Indicators scanner does not detect any result on moving averages that would impact this trend.
Technical indicators are strongly bullish, suggesting that the price increase should continue.
Caution: the Central Indicators scanner currently detects an excess:
CCI indicator is overbought : over 100
Type : Neutral
Timeframe : 1 hour
Williams %R indicator is overbought : over -20
Type : Neutral
Timeframe : 1 hour
Pivot points : price is over resistance 1
Type : Neutral
Timeframe : 1 hour
Pivot points : price is over resistance 1
Type : Neutral
Timeframe : Weekly
Central Patterns, the market scanner focusing on chart patterns, resistances and supports found this result:
Near horizontal resistance
Type : Bearish
Timeframe : 1 hour
Central Candlesticks, the scanner specialised in Japanese candlesticks, detects a bullish signal that could support the hypothesis of a small rebound in the very short term:
Bullish engulfing lines
Type : Bullish
Timeframe : 1 hour
| S3 | S2 | S1 | Price | R1 | R2 | R3 | |
|---|---|---|---|---|---|---|---|
| ProTrendLines | 73.58 | 83.78 | 95.71 | 100.07 | 106.67 | 111.17 | 127.89 |
| Change (%) | -26.47% | -16.28% | -4.36% | - | +6.60% | +11.09% | +27.80% |
| Change | -26.49 | -16.29 | -4.36 | - | +6.60 | +11.10 | +27.82 |
| Level | Intermediate | Major | Major | - | Major | Intermediate | Major |
Pivot points can also be used to set your price objectives. Here is the price situation in relation to pivot points:
| Pivot points | S3 | S2 | S1 | PP | R1 | R2 | R3 |
|---|---|---|---|---|---|---|---|
| Standard | 92.77 | 93.84 | 95.64 | 96.71 | 98.51 | 99.58 | 101.38 |
| Camarilla | 96.65 | 96.91 | 97.18 | 97.44 | 97.70 | 97.97 | 98.23 |
| Woodie | 93.14 | 94.02 | 96.01 | 96.89 | 98.88 | 99.76 | 101.75 |
| Fibonacci | 93.84 | 94.94 | 95.61 | 96.71 | 97.81 | 98.48 | 99.58 |
| Pivot points | S3 | S2 | S1 | PP | R1 | R2 | R3 |
|---|---|---|---|---|---|---|---|
| Standard | 77.53 | 81.22 | 87.15 | 90.84 | 96.77 | 100.46 | 106.39 |
| Camarilla | 90.44 | 91.32 | 92.20 | 93.08 | 93.96 | 94.84 | 95.73 |
| Woodie | 78.65 | 81.78 | 88.27 | 91.40 | 97.89 | 101.02 | 107.51 |
| Fibonacci | 81.22 | 84.90 | 87.17 | 90.84 | 94.52 | 96.79 | 100.46 |
| Pivot points | S3 | S2 | S1 | PP | R1 | R2 | R3 |
|---|---|---|---|---|---|---|---|
| Standard | 60.83 | 81.50 | 95.66 | 116.33 | 130.49 | 151.16 | 165.32 |
| Camarilla | 100.24 | 103.44 | 106.63 | 109.82 | 113.01 | 116.21 | 119.40 |
| Woodie | 57.58 | 79.87 | 92.41 | 114.70 | 127.24 | 149.53 | 162.07 |
| Fibonacci | 81.50 | 94.81 | 103.03 | 116.33 | 129.64 | 137.86 | 151.16 |
Numerical data
The following are the details of the technical indicators and moving averages that were collected to generate this technical analysis:
| RSI (14): | 67.74 | |
| MACD (12,26,9): | 1.3300 | |
| Directional Movement: | 16.68 | |
| AROON (14): | 85.72 | |
| DEMA (21): | 96.87 | |
| Parabolic SAR (0,02-0,02-0,2): | 96.26 | |
| Elder Ray (13): | 1.12 | |
| Super Trend (3,10): | 93.84 | |
| Zig ZAG (10): | 97.44 | |
| VORTEX (21): | 1.1800 | |
| Stochastique (14,3,5): | 93.74 | |
| TEMA (21): | 98.22 | |
| Williams %R (14): | -6.60 | |
| Chande Momentum Oscillator (20): | 1.93 | |
| Repulse (5,40,3): | 0.6200 | |
| ROCnROLL: | 1 | |
| TRIX (15,9): | 0.1900 | |
| Courbe Coppock: | 7.00 |
| MA7: | 91.92 | |
| MA20: | 103.29 | |
| MA50: | 122.63 | |
| MA100: | 121.42 | |
| MAexp7: | 96.87 | |
| MAexp20: | 95.28 | |
| MAexp50: | 95.16 | |
| MAexp100: | 99.71 | |
| Price / MA7: | +8.87% | |
| Price / MA20: | -3.12% | |
| Price / MA50: | -18.40% | |
| Price / MA100: | -17.58% | |
| Price / MAexp7: | +3.30% | |
| Price / MAexp20: | +5.03% | |
| Price / MAexp50: | +5.16% | |
| Price / MAexp100: | +0.36% |
News
Don't forget to follow the news on MICRON TECHNOLOGY INC.. At the time of publication of this analysis, the latest news was as follows:
- Droplet Micron Launches Expanded Indication and OTC Availability
- Thinking about trading options or stock in Micron Technology, Apple, Amazon.com, Palantir Technologies, or Microsoft?
- Thinking about trading options or stock in Super Micro Computer, Micron Technology, Tesla, Microsoft, or Intel?
- Thinking about trading options or stock in Micron Technology, Apple, PayPal, Super Micro Computer, or GigaCloud Technology?
-
 Is Micron a stock to watch? #stocks #micron #financialindustry
About author
Online


Add a comment
Comments
0 comments on the analysis MICRON TECHNOLOGY INC. - 1H