MICRON TECHNOLOGY INC. - 1H - Technical analysis published on 06/11/2024 (GMT)
- 202
- 0
Click here for a new analysis!
- Timeframe : 1H
- - Analysis generated on
- Status : TARGET REACHED

Summary of the analysis

Additional analysis
Quotes
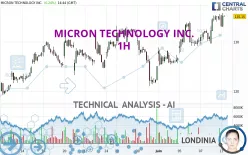
The MICRON TECHNOLOGY INC. rating is 134.77 USD. The price is lower by -0.04% since the last closing with the lowest point at 133.05 USD and the highest point at 135.49 USD. The deviation from the price is +1.29% for the low point and -0.53% for the high point.A bullish opening was detected by the Central Gaps scanner. Buyers are trying to impose a bullish momentum in the very short term.
Bullish opening
Type : Bullish
Timeframe : Openning
So that you have an overall view of the price change, here is a table showing the variations over several periods:
New HIGH record (5 years)
Type : Bullish
Timeframe : Weekly
Near a new HIGH record (1 year)
Type : Bullish
Timeframe : Weekly
Near a new HIGH record (1st january)
Type : Bullish
Timeframe : Weekly
Near a new HIGH record (1 month)
Type : Bullish
Timeframe : Weekly
Technical
Technical analysis of this 1H chart of MICRON TECHNOLOGY INC. indicates that the overall trend is strongly bullish. 92.86% of the signals given by moving averages are bullish. The overall trend is supported by the strong bullish signals from short-term moving averages. The Central Indicators market scanner currently does not detect any result that concerns moving averages.
In fact, according to the parameters integrated into the Central Analyzer system, 11 technical indicators out of 18 analysed are currently bullish. But beware of excesses. The Central Indicators scanner currently detects this:
Williams %R indicator is overbought : over -20
Type : Neutral
Timeframe : 1 hour
Price is back over the pivot point
Type : Bullish
Timeframe : 1 hour
Price is back over the pivot point
Type : Bullish
Timeframe : Weekly
An analysis of the price chart with the Central Patterns scanner (detector of chart patterns and resistances and supports) shows a result that can have an impact on the price change:
Near horizontal support
Type : Bullish
Timeframe : 1 hour
No result was found by the Central Candlesticks scanner on Japanese candlesticks.
| S3 | S2 | S1 | Price | |
|---|---|---|---|---|
| ProTrendLines | 128.01 | 130.18 | 133.26 | 134.77 |
| Change (%) | -5.02% | -3.41% | -1.12% | - |
| Change | -6.76 | -4.59 | -1.51 | - |
| Level | Major | Minor | Intermediate | - |
Attention could also be paid to pivot points to set price objectives:
| Pivot points | S3 | S2 | S1 | PP | R1 | R2 | R3 |
|---|---|---|---|---|---|---|---|
| Standard | 125.18 | 127.45 | 131.13 | 133.40 | 137.08 | 139.35 | 143.03 |
| Camarilla | 133.18 | 133.73 | 134.28 | 134.82 | 135.37 | 135.91 | 136.46 |
| Woodie | 125.90 | 127.80 | 131.85 | 133.75 | 137.80 | 139.70 | 143.75 |
| Fibonacci | 127.45 | 129.72 | 131.12 | 133.40 | 135.67 | 137.07 | 139.35 |
| Pivot points | S3 | S2 | S1 | PP | R1 | R2 | R3 |
|---|---|---|---|---|---|---|---|
| Standard | 117.02 | 121.08 | 126.01 | 130.07 | 135.00 | 139.06 | 143.99 |
| Camarilla | 128.47 | 129.29 | 130.12 | 130.94 | 131.76 | 132.59 | 133.41 |
| Woodie | 117.46 | 121.30 | 126.45 | 130.29 | 135.44 | 139.28 | 144.43 |
| Fibonacci | 121.08 | 124.51 | 126.64 | 130.07 | 133.50 | 135.63 | 139.06 |
| Pivot points | S3 | S2 | S1 | PP | R1 | R2 | R3 |
|---|---|---|---|---|---|---|---|
| Standard | 86.85 | 97.80 | 111.40 | 122.35 | 135.95 | 146.90 | 160.50 |
| Camarilla | 118.25 | 120.50 | 122.75 | 125.00 | 127.25 | 129.50 | 131.75 |
| Woodie | 88.18 | 98.46 | 112.73 | 123.01 | 137.28 | 147.56 | 161.83 |
| Fibonacci | 97.80 | 107.18 | 112.97 | 122.35 | 131.73 | 137.52 | 146.90 |
Numerical data
The following are the details of the technical indicators and moving averages that were collected to generate this technical analysis:
| RSI (14): | 62.34 | |
| MACD (12,26,9): | 1.3800 | |
| Directional Movement: | 5.81 | |
| AROON (14): | 42.85 | |
| DEMA (21): | 134.59 | |
| Parabolic SAR (0,02-0,02-0,2): | 131.94 | |
| Elder Ray (13): | 0.66 | |
| Super Trend (3,10): | 130.75 | |
| Zig ZAG (10): | 134.75 | |
| VORTEX (21): | 1.1300 | |
| Stochastique (14,3,5): | 76.01 | |
| TEMA (21): | 135.04 | |
| Williams %R (14): | -18.32 | |
| Chande Momentum Oscillator (20): | 2.45 | |
| Repulse (5,40,3): | -0.1200 | |
| ROCnROLL: | 1 | |
| TRIX (15,9): | 0.1500 | |
| Courbe Coppock: | 5.45 |
| MA7: | 131.27 | |
| MA20: | 128.95 | |
| MA50: | 122.36 | |
| MA100: | 107.59 | |
| MAexp7: | 134.11 | |
| MAexp20: | 132.80 | |
| MAexp50: | 130.83 | |
| MAexp100: | 128.86 | |
| Price / MA7: | +2.67% | |
| Price / MA20: | +4.51% | |
| Price / MA50: | +10.14% | |
| Price / MA100: | +25.26% | |
| Price / MAexp7: | +0.49% | |
| Price / MAexp20: | +1.48% | |
| Price / MAexp50: | +3.01% | |
| Price / MAexp100: | +4.59% |
News
The latest news and videos published on MICRON TECHNOLOGY INC. at the time of the analysis were as follows:
- Droplet Micron Launches Expanded Indication and OTC Availability
- Thinking about trading options or stock in Micron Technology, Apple, Amazon.com, Palantir Technologies, or Microsoft?
- Thinking about trading options or stock in Super Micro Computer, Micron Technology, Tesla, Microsoft, or Intel?
- Thinking about trading options or stock in Micron Technology, Apple, PayPal, Super Micro Computer, or GigaCloud Technology?
-
 Is Micron a stock to watch? #stocks #micron #financialindustry
About author
Online


Add a comment
Comments
0 comments on the analysis MICRON TECHNOLOGY INC. - 1H