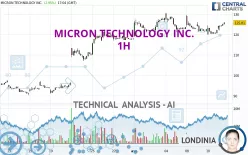
MICRON TECHNOLOGY INC. - 1H - Technical analysis published on 04/11/2024 (GMT)
- 260
- 0
Click here for a new analysis!
- Timeframe : 1H
- - Analysis generated on
- Status : INVALID
Summary of the analysis

Additional analysis
Quotes
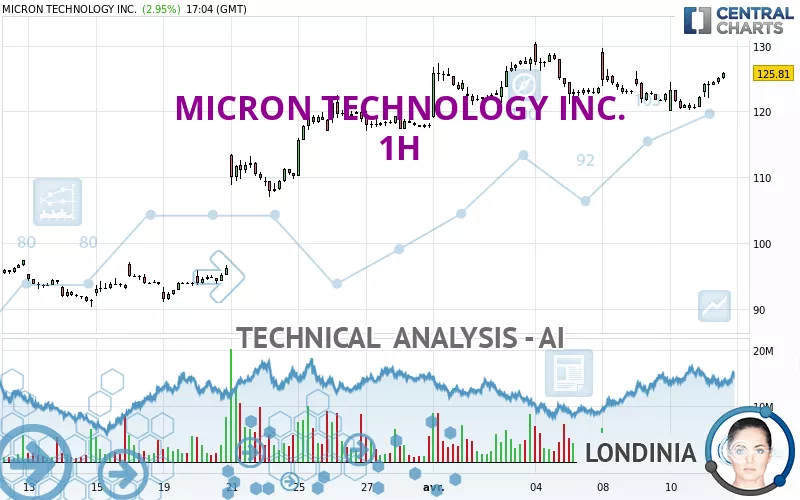
MICRON TECHNOLOGY INC. rating 125.51 USD. The price registered an increase of +2.71% on the session and was traded between 122.08 USD and 125.54 USD over the period. The price is currently at +2.81% from its lowest and -0.02% from its highest.The Central Gaps scanner detects a bullish opening marking the presence of buyers ahead of sellers at the opening but not sufficiently marked to allow the price to register a quotation gap.
Bullish opening
Type : Bullish
Timeframe : Openning
A study of price movements over other periods shows the following variations:
Near a new HIGH record (5 years)
Type : Bullish
Timeframe : Weekly
Near a new HIGH record (1 year)
Type : Bullish
Timeframe : Weekly
Near a new HIGH record (1st january)
Type : Bullish
Timeframe : Weekly
Near a new HIGH record (1 month)
Type : Bullish
Timeframe : Weekly
The Central Volumes scanner detects abnormal volumes on the asset:
Abnormal volumes
Timeframe : 20 days
Technical
Technical analysis of MICRON TECHNOLOGY INC. in 1H shows a strongly overall bullish trend. 89.29% of the signals given by moving averages are bullish. This strongly bullish trend is supported by the strong bullish signals given by short-term moving averages. The Central Indicators market scanner is currently detecting a bullish signal that could impact this trend:
Bullish trend reversal : Moving Average 20
Type : Bullish
Timeframe : 1 hour
An assessment of technical indicators shows a strong bullish signal.
But beware of excesses. The Central Indicators scanner currently detects this:
CCI indicator is overbought : over 100
Type : Neutral
Timeframe : 1 hour
Williams %R indicator is overbought : over -20
Type : Neutral
Timeframe : 1 hour
Pivot points : price is over resistance 1
Type : Neutral
Timeframe : 1 hour
MACD indicator is back over 0
Type : Bullish
Timeframe : 1 hour
The analysis of the price chart with Central Patterns scanners does not return any result.
The Central Candlesticks scanner which studies Japanese candlesticks did not detect anything.
| S3 | S2 | S1 | Price | R1 | |
|---|---|---|---|---|---|
| ProTrendLines | 101.75 | 117.11 | 121.18 | 125.51 | 128.01 |
| Change (%) | -18.93% | -6.69% | -3.45% | - | +1.99% |
| Change | -23.76 | -8.40 | -4.33 | - | +2.50 |
| Level | Minor | Minor | Intermediate | - | Major |
To determine price objectives, it is also possible to use the pivot points. Here is the price position in relation to pivot points:
| Pivot points | S3 | S2 | S1 | PP | R1 | R2 | R3 |
|---|---|---|---|---|---|---|---|
| Standard | 115.49 | 117.75 | 119.97 | 122.23 | 124.45 | 126.71 | 128.93 |
| Camarilla | 120.97 | 121.38 | 121.79 | 122.20 | 122.61 | 123.02 | 123.43 |
| Woodie | 115.48 | 117.74 | 119.96 | 122.22 | 124.44 | 126.70 | 128.92 |
| Fibonacci | 117.75 | 119.46 | 120.52 | 122.23 | 123.94 | 125.00 | 126.71 |
| Pivot points | S3 | S2 | S1 | PP | R1 | R2 | R3 |
|---|---|---|---|---|---|---|---|
| Standard | 106.67 | 112.83 | 118.21 | 124.37 | 129.75 | 135.91 | 141.29 |
| Camarilla | 120.41 | 121.46 | 122.52 | 123.58 | 124.64 | 125.70 | 126.75 |
| Woodie | 106.27 | 112.64 | 117.81 | 124.18 | 129.35 | 135.72 | 140.89 |
| Fibonacci | 112.83 | 117.24 | 119.97 | 124.37 | 128.78 | 131.51 | 135.91 |
| Pivot points | S3 | S2 | S1 | PP | R1 | R2 | R3 |
|---|---|---|---|---|---|---|---|
| Standard | 65.82 | 78.02 | 97.95 | 110.15 | 130.08 | 142.28 | 162.21 |
| Camarilla | 109.05 | 112.00 | 114.95 | 117.89 | 120.84 | 123.78 | 126.73 |
| Woodie | 69.70 | 79.95 | 101.83 | 112.08 | 133.96 | 144.21 | 166.09 |
| Fibonacci | 78.02 | 90.29 | 97.87 | 110.15 | 122.42 | 130.00 | 142.28 |
Numerical data
The following are the details of the technical indicators and moving averages that were collected to generate this technical analysis:
| RSI (14): | 59.27 | |
| MACD (12,26,9): | 0.0700 | |
| Directional Movement: | 17.36 | |
| AROON (14): | 71.43 | |
| DEMA (21): | 122.88 | |
| Parabolic SAR (0,02-0,02-0,2): | 125.81 | |
| Elder Ray (13): | 1.52 | |
| Super Trend (3,10): | 125.36 | |
| Zig ZAG (10): | 125.03 | |
| VORTEX (21): | 1.0000 | |
| Stochastique (14,3,5): | 93.71 | |
| TEMA (21): | 123.10 | |
| Williams %R (14): | -2.78 | |
| Chande Momentum Oscillator (20): | 3.35 | |
| Repulse (5,40,3): | 2.0400 | |
| ROCnROLL: | 1 | |
| TRIX (15,9): | -0.0500 | |
| Courbe Coppock: | 0.77 |
| MA7: | 124.07 | |
| MA20: | 113.81 | |
| MA50: | 98.56 | |
| MA100: | 90.00 | |
| MAexp7: | 123.93 | |
| MAexp20: | 122.97 | |
| MAexp50: | 122.42 | |
| MAexp100: | 118.41 | |
| Price / MA7: | +1.16% | |
| Price / MA20: | +10.28% | |
| Price / MA50: | +27.34% | |
| Price / MA100: | +39.46% | |
| Price / MAexp7: | +1.27% | |
| Price / MAexp20: | +2.07% | |
| Price / MAexp50: | +2.52% | |
| Price / MAexp100: | +6.00% |
News
Don't forget to follow the news on MICRON TECHNOLOGY INC.. At the time of publication of this analysis, the latest news was as follows:
- Thinking about trading options or stock in Micron Technology, Apple, Amazon.com, Palantir Technologies, or Microsoft?
- Thinking about trading options or stock in Super Micro Computer, Micron Technology, Tesla, Microsoft, or Intel?
- Thinking about trading options or stock in Micron Technology, Apple, PayPal, Super Micro Computer, or GigaCloud Technology?
-
 Is Micron a stock to watch? #stocks #micron #financialindustry
- Thinking about trading options or stock in Amazon.com, Micron Technology, JPMorgan Chase, Vale, or Lithium Americas?
About author
Online


Add a comment
Comments
0 comments on the analysis MICRON TECHNOLOGY INC. - 1H