MICRON TECHNOLOGY INC. - 1H - Technical analysis published on 04/08/2024 (GMT)
- 216
- 0
Click here for a new analysis!
- Timeframe : 1H
- - Analysis generated on
- Status : INVALID
Summary of the analysis

Additional analysis
Quotes
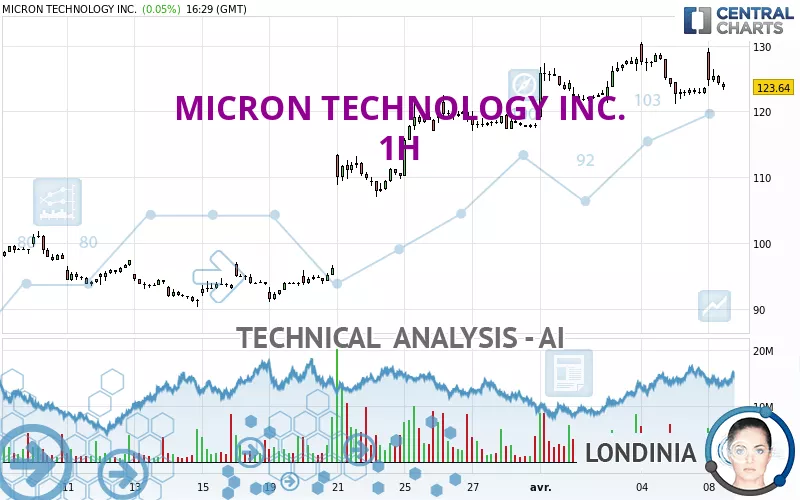
MICRON TECHNOLOGY INC. rating 123.53 USD. The price registered a decrease of -0.04% on the session with the lowest point at 123.19 USD and the highest point at 129.70 USD. The deviation from the price is +0.28% for the low point and -4.76% for the high point.A bullish gap was detected at the opening by the Central Gaps scanner. There are a lot of buyers and they have the upper hand in the very short term.
Opening Gap UP
Type : Bullish
Timeframe : Openning
So that you have an overall view of the price change, here is a table showing the variations over several periods:
Near a new HIGH record (5 years)
Type : Bullish
Timeframe : Weekly
Near a new HIGH record (1 year)
Type : Bullish
Timeframe : Weekly
Near a new HIGH record (1st january)
Type : Bullish
Timeframe : Weekly
Near a new HIGH record (1 month)
Type : Bullish
Timeframe : Weekly
The Central Volumes scanner detects abnormal volumes on the asset:
Abnormal volumes
Timeframe : 20 days
Technical
Technical analysis of this 1H chart of MICRON TECHNOLOGY INC. indicates that the overall trend is bullish. 71.43% of the signals given by moving averages are bullish. Caution: the neutral signals currently given by the short-term moving averages indicate that this bullish trend is showing signs of running out of steam. The Central Indicators market scanner is currently detecting several bearish signals that could impact this trend:
Bearish trend reversal : adaptative moving average 20
Type : Bearish
Timeframe : 1 hour
Bearish price crossover with adaptative moving average 100
Type : Bearish
Timeframe : 1 hour
In fact, Central Analyzer took into account 18 technical indicators and the result was as follows: 5 are bullish, 9 are neutral and 4 are bearish. Other results related to technical indicators were also found by the Central Indicators scanner:
RSI indicator is back under 50
Type : Bearish
Timeframe : 1 hour
Price is back under the pivot point
Type : Bearish
Timeframe : Weekly
No signals are given by Central Patterns, a market scanner specialised in chart patterns, resistances and supports.
No result was found by the Central Candlesticks scanner on Japanese candlesticks.
| S3 | S2 | S1 | Price | R1 | R2 | |
|---|---|---|---|---|---|---|
| ProTrendLines | 95.80 | 98.88 | 121.17 | 123.53 | 127.38 | 130.54 |
| Change (%) | -22.45% | -19.95% | -1.91% | - | +3.12% | +5.67% |
| Change | -27.73 | -24.65 | -2.36 | - | +3.85 | +7.01 |
| Level | Major | Intermediate | Intermediate | - | Minor | Intermediate |
To determine price objectives, it is also possible to use the pivot points. Here is the price position in relation to pivot points:
| Pivot points | S3 | S2 | S1 | PP | R1 | R2 | R3 |
|---|---|---|---|---|---|---|---|
| Standard | 118.36 | 119.78 | 121.68 | 123.10 | 125.00 | 126.42 | 128.32 |
| Camarilla | 122.67 | 122.97 | 123.28 | 123.58 | 123.88 | 124.19 | 124.49 |
| Woodie | 118.60 | 119.90 | 121.92 | 123.22 | 125.24 | 126.54 | 128.56 |
| Fibonacci | 119.78 | 121.05 | 121.83 | 123.10 | 124.37 | 125.15 | 126.42 |
| Pivot points | S3 | S2 | S1 | PP | R1 | R2 | R3 |
|---|---|---|---|---|---|---|---|
| Standard | 106.67 | 112.83 | 118.21 | 124.37 | 129.75 | 135.91 | 141.29 |
| Camarilla | 120.41 | 121.46 | 122.52 | 123.58 | 124.64 | 125.70 | 126.75 |
| Woodie | 106.27 | 112.64 | 117.81 | 124.18 | 129.35 | 135.72 | 140.89 |
| Fibonacci | 112.83 | 117.24 | 119.97 | 124.37 | 128.78 | 131.51 | 135.91 |
| Pivot points | S3 | S2 | S1 | PP | R1 | R2 | R3 |
|---|---|---|---|---|---|---|---|
| Standard | 65.82 | 78.02 | 97.95 | 110.15 | 130.08 | 142.28 | 162.21 |
| Camarilla | 109.05 | 112.00 | 114.95 | 117.89 | 120.84 | 123.78 | 126.73 |
| Woodie | 69.70 | 79.95 | 101.83 | 112.08 | 133.96 | 144.21 | 166.09 |
| Fibonacci | 78.02 | 90.29 | 97.87 | 110.15 | 122.42 | 130.00 | 142.28 |
Numerical data
The following is the status of technical indicators and moving averages registered at the time this technical analysis was created:
| RSI (14): | 48.25 | |
| MACD (12,26,9): | 0.0800 | |
| Directional Movement: | 14.14 | |
| AROON (14): | 50.00 | |
| DEMA (21): | 124.67 | |
| Parabolic SAR (0,02-0,02-0,2): | 121.70 | |
| Elder Ray (13): | -0.23 | |
| Super Trend (3,10): | 127.61 | |
| Zig ZAG (10): | 124.03 | |
| VORTEX (21): | 0.9300 | |
| Stochastique (14,3,5): | 39.00 | |
| TEMA (21): | 123.55 | |
| Williams %R (14): | -69.06 | |
| Chande Momentum Oscillator (20): | -1.21 | |
| Repulse (5,40,3): | -2.3400 | |
| ROCnROLL: | -1 | |
| TRIX (15,9): | 0.0300 | |
| Courbe Coppock: | 5.02 |
| MA7: | 123.47 | |
| MA20: | 109.66 | |
| MA50: | 96.44 | |
| MA100: | 88.59 | |
| MAexp7: | 124.09 | |
| MAexp20: | 124.33 | |
| MAexp50: | 122.16 | |
| MAexp100: | 116.24 | |
| Price / MA7: | +0.05% | |
| Price / MA20: | +12.65% | |
| Price / MA50: | +28.09% | |
| Price / MA100: | +39.44% | |
| Price / MAexp7: | -0.45% | |
| Price / MAexp20: | -0.64% | |
| Price / MAexp50: | +1.12% | |
| Price / MAexp100: | +6.27% |
News
Don't forget to follow the news on MICRON TECHNOLOGY INC.. At the time of publication of this analysis, the latest news was as follows:
- Thinking about trading options or stock in Micron Technology, Apple, Amazon.com, Palantir Technologies, or Microsoft?
- Thinking about trading options or stock in Super Micro Computer, Micron Technology, Tesla, Microsoft, or Intel?
- Thinking about trading options or stock in Micron Technology, Apple, PayPal, Super Micro Computer, or GigaCloud Technology?
-
 Is Micron a stock to watch? #stocks #micron #financialindustry
- Thinking about trading options or stock in Amazon.com, Micron Technology, JPMorgan Chase, Vale, or Lithium Americas?
About author
Online


Add a comment
Comments
0 comments on the analysis MICRON TECHNOLOGY INC. - 1H