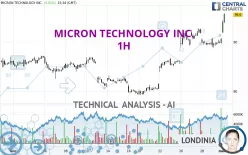
MICRON TECHNOLOGY INC. - 1H - Technical analysis published on 03/01/2024 (GMT)
- 173
- 0
Click here for a new analysis!
- Timeframe : 1H
- - Analysis generated on
- Status : TARGET REACHED

Summary of the analysis

Additional analysis
Quotes
MICRON TECHNOLOGY INC. rating 95.11 USD. The price registered an increase of +4.97% on the session and was between 91.92 USD and 95.88 USD. This implies that the price is at +3.47% from its lowest and at -0.80% from its highest.The Central Gaps scanner detects the formation of a bullish gap marking the strong presence of buyers against sellers at the opening. This formed a quotation gap.
Opening Gap UP
Type : Bullish
Timeframe : Openning
Here is a more detailed summary of the historical variations registered by MICRON TECHNOLOGY INC.:
Near a new HIGH record (5 years)
Type : Bullish
Timeframe : Weekly
New HIGH record (1 year)
Type : Bullish
Timeframe : Weekly
New HIGH record (1st january)
Type : Bullish
Timeframe : Weekly
New HIGH record (1 month)
Type : Bullish
Timeframe : Weekly
Technical
Technical analysis of MICRON TECHNOLOGY INC. in 1H shows a strongly overall bullish trend. The signals given by the moving averages are 92.86% bullish. This strong bullish trend is confirmed by the strong signals currently being given by short-term moving averages. The Central Indicators market scanner currently does not detect any result that concerns moving averages.
In fact, 15 technical indicators on 18 studied are currently bullish. Caution: the Central Indicators scanner currently detects an excess:
RSI indicator is overbought : over 70
Type : Neutral
Timeframe : 1 hour
CCI indicator is overbought : over 100
Type : Neutral
Timeframe : 1 hour
Previous candle closed over Bollinger bands
Type : Neutral
Timeframe : 1 hour
Williams %R indicator is overbought : over -20
Type : Neutral
Timeframe : 1 hour
Pivot points : price is over resistance 2
Type : Neutral
Timeframe : Weekly
Pivot points : price is over resistance 3
Type : Neutral
Timeframe : 1 hour
The Central Patterns scanner, which studies chart patterns, resistances and supports, has identified these signals:
Near horizontal resistance
Type : Bearish
Timeframe : 1 hour
Resistance of channel is broken
Type : Bullish
Timeframe : 1 hour
The Central Candlesticks scanner which studies Japanese candlesticks did not detect anything.
| S3 | S2 | S1 | Price | R1 | |
|---|---|---|---|---|---|
| ProTrendLines | 86.89 | 89.24 | 92.75 | 95.11 | 95.89 |
| Change (%) | -8.64% | -6.17% | -2.48% | - | +0.82% |
| Change | -8.22 | -5.87 | -2.36 | - | +0.78 |
| Level | Intermediate | Major | Intermediate | - | Major |
Attention could also be paid to pivot points to set price objectives:
| Pivot points | S3 | S2 | S1 | PP | R1 | R2 | R3 |
|---|---|---|---|---|---|---|---|
| Standard | 87.33 | 88.08 | 89.34 | 90.09 | 91.35 | 92.10 | 93.36 |
| Camarilla | 90.06 | 90.24 | 90.43 | 90.61 | 90.79 | 90.98 | 91.16 |
| Woodie | 87.60 | 88.21 | 89.61 | 90.22 | 91.62 | 92.23 | 93.63 |
| Fibonacci | 88.08 | 88.84 | 89.32 | 90.09 | 90.85 | 91.33 | 92.10 |
| Pivot points | S3 | S2 | S1 | PP | R1 | R2 | R3 |
|---|---|---|---|---|---|---|---|
| Standard | 73.49 | 76.32 | 81.16 | 83.99 | 88.83 | 91.66 | 96.50 |
| Camarilla | 83.89 | 84.59 | 85.30 | 86.00 | 86.70 | 87.41 | 88.11 |
| Woodie | 74.50 | 76.82 | 82.17 | 84.49 | 89.84 | 92.16 | 97.51 |
| Fibonacci | 76.32 | 79.25 | 81.06 | 83.99 | 86.92 | 88.73 | 91.66 |
| Pivot points | S3 | S2 | S1 | PP | R1 | R2 | R3 |
|---|---|---|---|---|---|---|---|
| Standard | 68.66 | 73.90 | 82.26 | 87.50 | 95.86 | 101.10 | 109.46 |
| Camarilla | 86.87 | 88.12 | 89.36 | 90.61 | 91.86 | 93.10 | 94.35 |
| Woodie | 70.21 | 74.68 | 83.81 | 88.28 | 97.41 | 101.88 | 111.01 |
| Fibonacci | 73.90 | 79.10 | 82.31 | 87.50 | 92.70 | 95.91 | 101.10 |
Numerical data
The following is the status of the technical indicators and moving averages at the time of publication of this technical analysis:
| RSI (14): | 77.86 | |
| MACD (12,26,9): | 1.0700 | |
| Directional Movement: | 35.85 | |
| AROON (14): | 50.00 | |
| DEMA (21): | 92.03 | |
| Parabolic SAR (0,02-0,02-0,2): | 88.93 | |
| Elder Ray (13): | 3.29 | |
| Super Trend (3,10): | 90.90 | |
| Zig ZAG (10): | 95.05 | |
| VORTEX (21): | 1.1400 | |
| Stochastique (14,3,5): | 93.83 | |
| TEMA (21): | 92.03 | |
| Williams %R (14): | -3.54 | |
| Chande Momentum Oscillator (20): | 5.71 | |
| Repulse (5,40,3): | 4.1100 | |
| ROCnROLL: | 1 | |
| TRIX (15,9): | 0.1300 | |
| Courbe Coppock: | 2.07 |
| MA7: | 89.91 | |
| MA20: | 85.72 | |
| MA50: | 85.35 | |
| MA100: | 79.22 | |
| MAexp7: | 92.21 | |
| MAexp20: | 90.63 | |
| MAexp50: | 88.54 | |
| MAexp100: | 86.82 | |
| Price / MA7: | +5.78% | |
| Price / MA20: | +10.95% | |
| Price / MA50: | +11.44% | |
| Price / MA100: | +20.06% | |
| Price / MAexp7: | +3.14% | |
| Price / MAexp20: | +4.94% | |
| Price / MAexp50: | +7.42% | |
| Price / MAexp100: | +9.55% |
News
The last news published on MICRON TECHNOLOGY INC. at the time of the generation of this analysis was as follows:
- Thinking about trading options or stock in Walmart, Micron Technology, Apple, Unity Software, or Aaron's Company?
- Thinking about buying stock in Psyence Biomedical, Micron Technology, Conservative Broadcast Media Journalism, Qualcomm, or Cibus?
- Thinking about trading options or stock in Wayfair, Tesla, Micron Technology, Verizon Communications, or Leidos Holdings?
- Thinking about buying stock in Micron Technology, Marathon Digital, Cameco Corp, ON Semiconductor, or iCoreConnect?
- Thinking about trading options or stock in Apple, Micron Technology, Novo Nordisk, Zoom Video, or Hut 8?
About author
Online


Add a comment
Comments
0 comments on the analysis MICRON TECHNOLOGY INC. - 1H