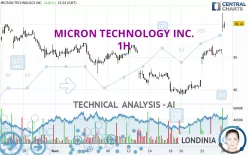
MICRON TECHNOLOGY INC. - 1H - Technical analysis published on 02/26/2024 (GMT)
- 190
- 0
- Who voted?
Click here for a new analysis!
- Timeframe : 1H
- - Analysis generated on
- Status : TARGET REACHED

Summary of the analysis

Additional analysis
Quotes
The MICRON TECHNOLOGY INC. price is 90.35 USD. On the day, this instrument gained +5.06% and was traded between 88.90 USD and 91.74 USD over the period. The price is currently at +1.63% from its lowest and -1.52% from its highest.The Central Gaps scanner detects a bullish gap which is a sign that buyers have taken the lead in the very short term.
Opening Gap UP
Type : Bullish
Timeframe : Openning
So that you have an overall view of the price change, here is a table showing the variations over several periods:
New HIGH record (1 year)
Type : Bullish
Timeframe : Weekly
New HIGH record (1st january)
Type : Bullish
Timeframe : Weekly
New HIGH record (1 month)
Type : Bullish
Timeframe : Weekly
Technical
A technical analysis in 1H of this MICRON TECHNOLOGY INC. chart shows a strongly bullish trend. 89.29% of the signals given by moving averages are bullish. This strongly bullish trend is supported by the strong bullish signals given by short-term moving averages. There is no crossing of moving average by the price or crossing of moving averages between themselves.
In fact, 15 technical indicators on 18 studied are currently bullish. Caution: the Central Indicators scanner currently detects an excess:
RSI indicator is overbought : over 80
Type : Neutral
Timeframe : 1 hour
CCI indicator is overbought : over 100
Type : Neutral
Timeframe : 1 hour
CCI indicator: bearish divergence
Type : Bearish
Timeframe : 1 hour
RSI indicator: bearish divergence
Type : Bearish
Timeframe : 1 hour
Pivot points : price is over resistance 1
Type : Neutral
Timeframe : Weekly
Pivot points : price is over resistance 3
Type : Neutral
Timeframe : 1 hour
An analysis of the price chart with the Central Patterns scanner (detector of chart patterns and resistances and supports) shows a result that can have an impact on the price change:
Resistance of channel is broken
Type : Bullish
Timeframe : 1 hour
The Central Candlesticks scanner, specialised in Japanese candlesticks, did not identify any signals.
| S3 | S2 | S1 | Price | R1 | |
|---|---|---|---|---|---|
| ProTrendLines | 85.01 | 86.95 | 89.24 | 90.35 | 95.89 |
| Change (%) | -5.91% | -3.76% | -1.23% | - | +6.13% |
| Change | -5.34 | -3.40 | -1.11 | - | +5.54 |
| Level | Minor | Intermediate | Major | - | Major |
Attention could also be paid to pivot points to set price objectives:
| Pivot points | S3 | S2 | S1 | PP | R1 | R2 | R3 |
|---|---|---|---|---|---|---|---|
| Standard | 83.32 | 84.19 | 85.09 | 85.96 | 86.86 | 87.73 | 88.63 |
| Camarilla | 85.51 | 85.68 | 85.84 | 86.00 | 86.16 | 86.33 | 86.49 |
| Woodie | 83.35 | 84.20 | 85.12 | 85.97 | 86.89 | 87.74 | 88.66 |
| Fibonacci | 84.19 | 84.86 | 85.28 | 85.96 | 86.63 | 87.05 | 87.73 |
| Pivot points | S3 | S2 | S1 | PP | R1 | R2 | R3 |
|---|---|---|---|---|---|---|---|
| Standard | 73.49 | 76.32 | 81.16 | 83.99 | 88.83 | 91.66 | 96.50 |
| Camarilla | 83.89 | 84.59 | 85.30 | 86.00 | 86.70 | 87.41 | 88.11 |
| Woodie | 74.50 | 76.82 | 82.17 | 84.49 | 89.84 | 92.16 | 97.51 |
| Fibonacci | 76.32 | 79.25 | 81.06 | 83.99 | 86.92 | 88.73 | 91.66 |
| Pivot points | S3 | S2 | S1 | PP | R1 | R2 | R3 |
|---|---|---|---|---|---|---|---|
| Standard | 71.41 | 76.00 | 80.87 | 85.46 | 90.33 | 94.92 | 99.79 |
| Camarilla | 83.15 | 84.02 | 84.88 | 85.75 | 86.62 | 87.48 | 88.35 |
| Woodie | 71.56 | 76.07 | 81.02 | 85.53 | 90.48 | 94.99 | 99.94 |
| Fibonacci | 76.00 | 79.61 | 81.84 | 85.46 | 89.07 | 91.30 | 94.92 |
Numerical data
The following is the status of technical indicators and moving averages registered at the time this technical analysis was created:
| RSI (14): | 84.70 | |
| MACD (12,26,9): | 1.6800 | |
| Directional Movement: | 45.18 | |
| AROON (14): | 92.86 | |
| DEMA (21): | 87.50 | |
| Parabolic SAR (0,02-0,02-0,2): | 85.53 | |
| Elder Ray (13): | 3.36 | |
| Super Trend (3,10): | 86.74 | |
| Zig ZAG (10): | 90.10 | |
| VORTEX (21): | 1.1800 | |
| Stochastique (14,3,5): | 72.20 | |
| TEMA (21): | 88.74 | |
| Williams %R (14): | -25.19 | |
| Chande Momentum Oscillator (20): | 4.04 | |
| Repulse (5,40,3): | -0.0700 | |
| ROCnROLL: | 1 | |
| TRIX (15,9): | 0.2400 | |
| Courbe Coppock: | 9.62 |
| MA7: | 83.61 | |
| MA20: | 84.70 | |
| MA50: | 84.50 | |
| MA100: | 78.29 | |
| MAexp7: | 87.57 | |
| MAexp20: | 85.41 | |
| MAexp50: | 83.90 | |
| MAexp100: | 83.88 | |
| Price / MA7: | +8.06% | |
| Price / MA20: | +6.67% | |
| Price / MA50: | +6.92% | |
| Price / MA100: | +15.40% | |
| Price / MAexp7: | +3.17% | |
| Price / MAexp20: | +5.78% | |
| Price / MAexp50: | +7.69% | |
| Price / MAexp100: | +7.71% |
News
The latest news and videos published on MICRON TECHNOLOGY INC. at the time of the analysis were as follows:
- Thinking about buying stock in Psyence Biomedical, Micron Technology, Conservative Broadcast Media Journalism, Qualcomm, or Cibus?
- Thinking about trading options or stock in Wayfair, Tesla, Micron Technology, Verizon Communications, or Leidos Holdings?
- Thinking about buying stock in Micron Technology, Marathon Digital, Cameco Corp, ON Semiconductor, or iCoreConnect?
- Thinking about trading options or stock in Apple, Micron Technology, Novo Nordisk, Zoom Video, or Hut 8?
- Thinking about trading options or stock in Apellis Pharmaceuticals, Meta Platforms, NVIDIA, Micron Technology, or Gold Fields Limited?
About author
Online


Add a comment
Comments
0 comments on the analysis MICRON TECHNOLOGY INC. - 1H