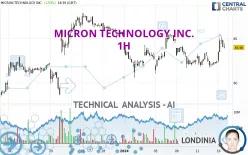
MICRON TECHNOLOGY INC. - 1H - Technical analysis published on 01/16/2024 (GMT)
- 198
- 0
Click here for a new analysis!
- Timeframe : 1H
- - Analysis generated on
- Status : INVALID

Summary of the analysis

Additional analysis
Quotes
The MICRON TECHNOLOGY INC. price is 84.26 USD. On the day, this instrument gained +2.27% and was traded between 82.33 USD and 85.21 USD over the period. The price is currently at +2.34% from its lowest and -1.11% from its highest.The Central Gaps scanner detects a bullish opening. A small advantage for buyers in the very short term.
Bullish opening
Type : Bullish
Timeframe : Openning
Here is a more detailed summary of the historical variations registered by MICRON TECHNOLOGY INC.:
Near a new HIGH record (1 year)
Type : Bullish
Timeframe : Weekly
Near a new LOW record (1st january)
Type : Bearish
Timeframe : Weekly
Near a new HIGH record (1 month)
Type : Bullish
Timeframe : Weekly
Technical
Technical analysis of this 1H chart of MICRON TECHNOLOGY INC. indicates that the overall trend is bullish. 71.43% of the signals given by moving averages are bullish. The overall trend is reinforced by the strong bullish signals from short-term moving averages. The Central Indicators market scanner is currently detecting several bullish signals that could impact this trend:
Bullish price crossover with Moving Average 100
Type : Bullish
Timeframe : 1 hour
Bullish price crossover with adaptative moving average 100
Type : Bullish
Timeframe : 1 hour
Technical indicators are strongly bullish, suggesting that the price increase should continue.
Caution: the Central Indicators scanner currently detects an excess:
CCI indicator is overbought : over 100
Type : Neutral
Timeframe : 1 hour
Pivot points : price is over resistance 2
Type : Neutral
Timeframe : 1 hour
Price is back over the pivot point
Type : Bullish
Timeframe : Weekly
The Central Patterns scanner, which studies chart patterns, resistances and supports, has identified these signals:
Near horizontal resistance
Type : Bearish
Timeframe : 1 hour
Resistance of channel is broken
Type : Bullish
Timeframe : 1 hour
For a small rebound in the very short term, the Central Candlesticks scanner currently notes the presence of this bullish pattern in Japanese candlesticks:
Bullish harami
Type : Bullish
Timeframe : 1 hour
| S3 | S2 | S1 | Price | R1 | R2 | R3 | |
|---|---|---|---|---|---|---|---|
| ProTrendLines | 78.48 | 81.69 | 83.28 | 84.26 | 85.55 | 86.94 | 95.89 |
| Change (%) | -6.86% | -3.05% | -1.16% | - | +1.53% | +3.18% | +13.80% |
| Change | -5.78 | -2.57 | -0.98 | - | +1.29 | +2.68 | +11.63 |
| Level | Intermediate | Intermediate | Major | - | Intermediate | Major | Major |
To determine price objectives, it is also possible to use the pivot points. Here is the price position in relation to pivot points:
| Pivot points | S3 | S2 | S1 | PP | R1 | R2 | R3 |
|---|---|---|---|---|---|---|---|
| Standard | 80.37 | 81.04 | 81.71 | 82.38 | 83.05 | 83.72 | 84.39 |
| Camarilla | 82.02 | 82.14 | 82.27 | 82.39 | 82.51 | 82.64 | 82.76 |
| Woodie | 80.38 | 81.04 | 81.72 | 82.38 | 83.06 | 83.72 | 84.40 |
| Fibonacci | 81.04 | 81.55 | 81.87 | 82.38 | 82.89 | 83.21 | 83.72 |
| Pivot points | S3 | S2 | S1 | PP | R1 | R2 | R3 |
|---|---|---|---|---|---|---|---|
| Standard | 77.01 | 79.34 | 80.86 | 83.19 | 84.71 | 87.04 | 88.56 |
| Camarilla | 81.33 | 81.68 | 82.04 | 82.39 | 82.74 | 83.10 | 83.45 |
| Woodie | 76.62 | 79.14 | 80.47 | 82.99 | 84.32 | 86.84 | 88.17 |
| Fibonacci | 79.34 | 80.81 | 81.72 | 83.19 | 84.66 | 85.57 | 87.04 |
| Pivot points | S3 | S2 | S1 | PP | R1 | R2 | R3 |
|---|---|---|---|---|---|---|---|
| Standard | 61.28 | 67.05 | 76.20 | 81.97 | 91.12 | 96.89 | 106.04 |
| Camarilla | 81.24 | 82.61 | 83.97 | 85.34 | 86.71 | 88.08 | 89.44 |
| Woodie | 62.96 | 67.90 | 77.88 | 82.82 | 92.80 | 97.74 | 107.72 |
| Fibonacci | 67.05 | 72.75 | 76.27 | 81.97 | 87.67 | 91.19 | 96.89 |
Numerical data
The following is the status of technical indicators and moving averages registered at the time this technical analysis was created:
| RSI (14): | 60.90 | |
| MACD (12,26,9): | 0.2900 | |
| Directional Movement: | 11.43 | |
| AROON (14): | 57.14 | |
| DEMA (21): | 83.50 | |
| Parabolic SAR (0,02-0,02-0,2): | 82.27 | |
| Elder Ray (13): | 0.72 | |
| Super Trend (3,10): | 82.71 | |
| Zig ZAG (10): | 84.35 | |
| VORTEX (21): | 1.0800 | |
| Stochastique (14,3,5): | 76.84 | |
| TEMA (21): | 83.94 | |
| Williams %R (14): | -24.63 | |
| Chande Momentum Oscillator (20): | 0.96 | |
| Repulse (5,40,3): | 0.5900 | |
| ROCnROLL: | 1 | |
| TRIX (15,9): | 0.0000 | |
| Courbe Coppock: | 2.84 |
| MA7: | 83.46 | |
| MA20: | 83.57 | |
| MA50: | 78.82 | |
| MA100: | 73.51 | |
| MAexp7: | 83.86 | |
| MAexp20: | 83.27 | |
| MAexp50: | 83.26 | |
| MAexp100: | 83.07 | |
| Price / MA7: | +0.96% | |
| Price / MA20: | +0.83% | |
| Price / MA50: | +6.90% | |
| Price / MA100: | +14.62% | |
| Price / MAexp7: | +0.48% | |
| Price / MAexp20: | +1.19% | |
| Price / MAexp50: | +1.20% | |
| Price / MAexp100: | +1.43% |
News
The latest news and videos published on MICRON TECHNOLOGY INC. at the time of the analysis were as follows:
- Thinking about buying stock in Micron Technology, Marathon Digital, Cameco Corp, ON Semiconductor, or iCoreConnect?
- Thinking about trading options or stock in Apple, Micron Technology, Novo Nordisk, Zoom Video, or Hut 8?
- Thinking about trading options or stock in Apellis Pharmaceuticals, Meta Platforms, NVIDIA, Micron Technology, or Gold Fields Limited?
- Thinking about trading options or stock in Meta Platforms, Eli Lilly, Micron Technology, Seagen Inc, or Cigna?
- Thinking about trading options or stock in ASML Holding, NVIDIA, Micron Technology, Alibaba Group, or Li Auto?
About author
Online


Add a comment
Comments
0 comments on the analysis MICRON TECHNOLOGY INC. - 1H