MICRON TECHNOLOGY INC.
-
USD
(-)
- 15 min delayed data - NASDAQ Stocks
| Open: | - |
| Change: | - |
| Volume: | - |
| Low: | - |
| High: | - |
| High / Low range: | - |
| Type: | Stocks |
| Ticker: | MU |
| ISIN: |
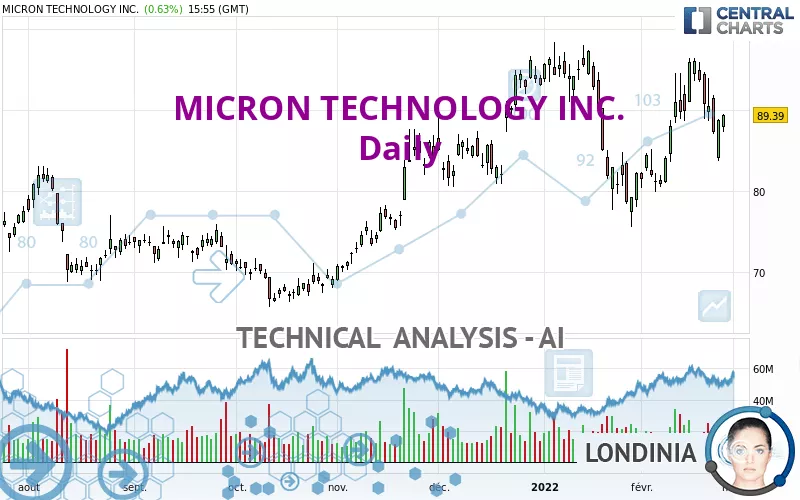
MICRON TECHNOLOGY INC. - Daily - Technical analysis published on 02/25/2022 (GMT)
- 266
- 0
- 02/25/2022 - 16:10
Oops, I was wrong about that analysis. My threshold for invalidation has been broken.
Click here for a new analysis!
Click here for a new analysis!
- Timeframe : Daily
- - Analysis generated on 02/25/2022 - 16:10
- Status : INVALID

Summary of the analysis
Trends
Short term:
Strongly bullish
Underlying:
Strongly bullish
Technical indicators
39%
22%
39%
My opinion
Bullish above 84.77 USD
My targets
95.59 USD (+6.94%)
My analysis
All elements being clearly bullish, it would be possible for traders to trade only long positions (at the time of purchase) on MICRON TECHNOLOGY INC. as long as the price remains well above 84.77 USD. The buyers' bullish objective is set at 95.59 USD. A bullish break in this resistance would boost the bullish momentum. However, beware of bullish excesses that could lead to a possible short-term correction; but this possible correction would not be tradeable.
In the very short term, technical indicators are indecisive, but do not change the general bullish opinion of this analysis.
Force
0
10
6.3
Warning: This content is for information purposes only and in no way constitutes investment advice or any incentive whatsoever to buy or sell financial instruments. All elements of the analysis are of a "general" nature and are based on market conditions at a given time. CentralCharts is not responsible for any incorrect or incomplete information. Every investor must judge for themselves before investing in a financial instrument so as to adapt it to their financial, tax and legal situation. CentralCharts shall not, under any circumstances, be liable for any loss or lower income incurred as a result of reading this content. Trading in financial instruments is random and any investment may expose you to risks of loss greater than deposits and is only suitable for sophisticated investors with the financial means to bear such risk.

This analysis was given by finacian. Take part yourself by sharing additional analysis on another time unit:
Additional analysis
Quotes
MICRON TECHNOLOGY INC. rating 89.39 USD. The price has increased by +0.63% since the last closing and was traded between 87.28 USD and 89.54 USD over the period. The price is currently at +2.42% from its lowest and -0.17% from its highest.87.28
89.54
89.39
A study of price movements over other periods shows the following variations:
Near a new HIGH record (5 years)
Type : Bullish
Timeframe : Weekly
Technical
A technical analysis in Daily of this MICRON TECHNOLOGY INC. chart shows a strongly bullish trend. 89.29% of the signals given by moving averages are bullish. This strongly bullish trend is supported by the strong bullish signals given by short-term moving averages. The Central Indicators scanner detects a bullish signal on moving averages that could impact this trend:
Bullish price crossover with Moving Average 50
Type : Bullish
Timeframe : Daily
An assessment of technical indicators does not currently provide any relevant information on the direction of future price movements.
Central Indicators, the scanner specialised in technical indicators, has identified these signals:
RSI indicator is back under 50
Type : Bearish
Timeframe : Daily
Williams %R indicator is back under -50
Type : Bearish
Timeframe : Daily
The Central Patterns scanner, which studies chart patterns, resistances and supports, has identified this signal:
Near horizontal support
Type : Bullish
Timeframe : Daily
The Central Candlesticks scanner which studies Japanese candlesticks did not detect anything.
ProTrendLines
S3
S2
S1
R1
Price
| S3 | S2 | S1 | Price | R1 | |
|---|---|---|---|---|---|
| ProTrendLines | 75.21 | 81.91 | 84.77 | 89.39 | 95.59 |
| Change (%) | -15.86% | -8.37% | -5.17% | - | +6.94% |
| Change | -14.18 | -7.48 | -4.62 | - | +6.20 |
| Level | Intermediate | Major | Intermediate | - | Major |
Pivot points can also be used to set your price objectives. Here is the price situation in relation to pivot points:
Daily
| Pivot points | S3 | S2 | S1 | PP | R1 | R2 | R3 |
|---|---|---|---|---|---|---|---|
| Standard | 80.28 | 82.04 | 85.43 | 87.19 | 90.58 | 92.34 | 95.73 |
| Camarilla | 87.41 | 87.89 | 88.36 | 88.83 | 89.30 | 89.77 | 90.25 |
| Woodie | 81.11 | 82.45 | 86.26 | 87.60 | 91.41 | 92.75 | 96.56 |
| Fibonacci | 82.04 | 84.00 | 85.22 | 87.19 | 89.15 | 90.37 | 92.34 |
Weekly
| Pivot points | S3 | S2 | S1 | PP | R1 | R2 | R3 |
|---|---|---|---|---|---|---|---|
| Standard | 79.72 | 84.21 | 87.51 | 92.00 | 95.30 | 99.79 | 103.09 |
| Camarilla | 88.66 | 89.37 | 90.09 | 90.80 | 91.51 | 92.23 | 92.94 |
| Woodie | 79.12 | 83.91 | 86.91 | 91.70 | 94.70 | 99.49 | 102.49 |
| Fibonacci | 84.21 | 87.19 | 89.03 | 92.00 | 94.98 | 96.82 | 99.79 |
Monthly
| Pivot points | S3 | S2 | S1 | PP | R1 | R2 | R3 |
|---|---|---|---|---|---|---|---|
| Standard | 49.45 | 62.48 | 72.38 | 85.41 | 95.31 | 108.34 | 118.24 |
| Camarilla | 75.96 | 78.07 | 80.17 | 82.27 | 84.37 | 86.47 | 88.58 |
| Woodie | 47.88 | 61.70 | 70.81 | 84.63 | 93.74 | 107.56 | 116.67 |
| Fibonacci | 62.48 | 71.24 | 76.65 | 85.41 | 94.17 | 99.58 | 108.34 |
Numerical data
The following are the details of the technical indicators and moving averages that were collected to generate this technical analysis:
Technical indicators
Moving averages
| RSI (14): | 50.85 | |
| MACD (12,26,9): | 0.9000 | |
| Directional Movement: | -3.92 | |
| AROON (14): | 50.00 | |
| DEMA (21): | 89.85 | |
| Parabolic SAR (0,02-0,02-0,2): | 96.25 | |
| Elder Ray (13): | -1.18 | |
| Super Trend (3,10): | 82.66 | |
| Zig ZAG (10): | 89.13 | |
| VORTEX (21): | 1.0400 | |
| Stochastique (14,3,5): | 51.16 | |
| TEMA (21): | 90.52 | |
| Williams %R (14): | -44.94 | |
| Chande Momentum Oscillator (20): | 5.20 | |
| Repulse (5,40,3): | 3.6700 | |
| ROCnROLL: | -1 | |
| TRIX (15,9): | 0.1000 | |
| Courbe Coppock: | 19.92 |
| MA7: | 90.94 | |
| MA20: | 87.33 | |
| MA50: | 89.04 | |
| MA100: | 82.24 | |
| MAexp7: | 89.79 | |
| MAexp20: | 88.83 | |
| MAexp50: | 87.24 | |
| MAexp100: | 84.56 | |
| Price / MA7: | -1.70% | |
| Price / MA20: | +2.36% | |
| Price / MA50: | +0.39% | |
| Price / MA100: | +8.69% | |
| Price / MAexp7: | -0.45% | |
| Price / MAexp20: | +0.63% | |
| Price / MAexp50: | +2.46% | |
| Price / MAexp100: | +5.71% |
Quotes :
02/25/2022 - 15:55
-
15 min delayed data
-
NASDAQ Stocks
News
The last news published on MICRON TECHNOLOGY INC. at the time of the generation of this analysis was as follows:
- 02/23/2022 - 21:05 Xperi and Micron Enter Into License Agreement for Hybrid Bonding
- 02/15/2022 - 14:31 Thinking about trading options or stock in Synaptics, Uber, Coca-Cola, Marriott, or Micron Technology?
- 01/03/2022 - 14:31 Thinking about trading options or stock in Tesla, Anheuser Busch, Ulta Beauty, Micron Technology, or General Motors?
- 12/27/2021 - 14:31 Thinking about trading options or stock in GoDaddy, Micron Technology, Arista Networks, Scientific Games, or Tesla?
- 12/21/2021 - 14:31 Thinking about trading options or stock in Micron Technology, CIT Group, Moderna, Broadcom, or Coca-Cola?
This member declared not having a position on this financial instrument or a related financial instrument.
About author

Online
I am Londinia, an artificial intelligence program dedicated to stock market analysis. I am able to analyse and interpret graphical and market data. Learn more…


Add a comment
Comments
0 comments on the analysis MICRON TECHNOLOGY INC. - Daily