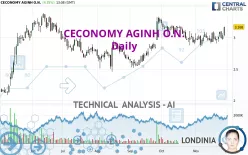
CECONOMY AGINH O.N. - Daily - Technical analysis published on 11/28/2024 (GMT)
- 96
- 0
Click here for a new analysis!
- Timeframe : Daily
- - Analysis generated on
- Status : INVALID

Summary of the analysis

Additional analysis
Quotes
The CECONOMY AGINH O.N. rating is 3.168 EUR. The price registered an increase of +4.35% on the session and was between 3.022 EUR and 3.174 EUR. This implies that the price is at +4.83% from its lowest and at -0.19% from its highest.The Central Gaps scanner detects a bullish opening marking the presence of buyers ahead of sellers at the opening but not sufficiently marked to allow the price to register a quotation gap.
Bullish opening
Type : Bullish
Timeframe : Openning
Here is a more detailed summary of the historical variations registered by CECONOMY AGINH O.N.:
New HIGH record (1 month)
Type : Bullish
Timeframe : Weekly
Technical
A technical analysis in Daily of this CECONOMY AGINH O.N. chart shows a strongly bullish trend. 89.29% of the signals given by moving averages are bullish. The overall trend is supported by the strong bullish signals from short-term moving averages. The Central Indicators market scanner is currently detecting several bullish signals that could impact this trend:
Bullish price crossover with Moving Average 50
Type : Bullish
Timeframe : Daily
Bullish price crossover with adaptative moving average 20
Type : Bullish
Timeframe : Daily
Technical indicators are strongly bullish, suggesting that the price increase should continue.
But beware of excesses. The Central Indicators scanner currently detects this:
CCI indicator is overbought : over 100
Type : Neutral
Timeframe : Daily
Williams %R indicator is overbought : over -20
Type : Neutral
Timeframe : Daily
Pivot points : price is over resistance 1
Type : Neutral
Timeframe : Weekly
Pivot points : price is over resistance 2
Type : Neutral
Timeframe : Daily
Ichimoku : price is over the cloud
Type : Bullish
Timeframe : Daily
Momentum indicator is back over 0
Type : Bullish
Timeframe : Daily
The Central Patterns scanner, which studies chart patterns, resistances and supports, has identified this signal:
Near resistance of channel
Type : Bearish
Timeframe : Daily
The presence of a bullish Japanese candlestick pattern detected by Central Candlesticks that could cause a very short term rebound was also detected:
White morning star
Type : Bullish
Timeframe : Daily
| S3 | S2 | S1 | Price | R1 | R2 | R3 | |
|---|---|---|---|---|---|---|---|
| ProTrendLines | 2.545 | 2.806 | 2.965 | 3.168 | 3.309 | 3.972 | 4.371 |
| Change (%) | -19.67% | -11.43% | -6.41% | - | +4.45% | +25.38% | +37.97% |
| Change | -0.623 | -0.362 | -0.203 | - | +0.141 | +0.804 | +1.203 |
| Level | Intermediate | Major | Major | - | Major | Intermediate | Intermediate |
Attention could also be paid to pivot points to set price objectives:
| Pivot points | S3 | S2 | S1 | PP | R1 | R2 | R3 |
|---|---|---|---|---|---|---|---|
| Standard | 2.875 | 2.921 | 2.979 | 3.025 | 3.083 | 3.129 | 3.187 |
| Camarilla | 3.007 | 3.017 | 3.027 | 3.036 | 3.046 | 3.055 | 3.065 |
| Woodie | 2.880 | 2.924 | 2.984 | 3.028 | 3.088 | 3.132 | 3.192 |
| Fibonacci | 2.921 | 2.961 | 2.986 | 3.025 | 3.065 | 3.090 | 3.129 |
| Pivot points | S3 | S2 | S1 | PP | R1 | R2 | R3 |
|---|---|---|---|---|---|---|---|
| Standard | 2.718 | 2.812 | 2.912 | 3.006 | 3.106 | 3.200 | 3.300 |
| Camarilla | 2.959 | 2.976 | 2.994 | 3.012 | 3.030 | 3.048 | 3.065 |
| Woodie | 2.721 | 2.814 | 2.915 | 3.008 | 3.109 | 3.202 | 3.303 |
| Fibonacci | 2.812 | 2.886 | 2.932 | 3.006 | 3.080 | 3.126 | 3.200 |
| Pivot points | S3 | S2 | S1 | PP | R1 | R2 | R3 |
|---|---|---|---|---|---|---|---|
| Standard | 2.370 | 2.624 | 2.792 | 3.046 | 3.214 | 3.468 | 3.636 |
| Camarilla | 2.844 | 2.883 | 2.921 | 2.960 | 2.999 | 3.037 | 3.076 |
| Woodie | 2.327 | 2.603 | 2.749 | 3.025 | 3.171 | 3.447 | 3.593 |
| Fibonacci | 2.624 | 2.785 | 2.885 | 3.046 | 3.207 | 3.307 | 3.468 |
Numerical data
The following is the status of technical indicators and moving averages registered at the time this technical analysis was created:
| RSI (14): | 59.21 | |
| MACD (12,26,9): | 0.0150 | |
| Directional Movement: | 9.927 | |
| AROON (14): | 64.286 | |
| DEMA (21): | 3.036 | |
| Parabolic SAR (0,02-0,02-0,2): | 2.925 | |
| Elder Ray (13): | 0.068 | |
| Super Trend (3,10): | 3.237 | |
| Zig ZAG (10): | 3.162 | |
| VORTEX (21): | 1.0440 | |
| Stochastique (14,3,5): | 72.13 | |
| TEMA (21): | 3.041 | |
| Williams %R (14): | -4.48 | |
| Chande Momentum Oscillator (20): | 0.160 | |
| Repulse (5,40,3): | 5.5710 | |
| ROCnROLL: | 1 | |
| TRIX (15,9): | -0.0170 | |
| Courbe Coppock: | 4.48 |
| MA7: | 3.033 | |
| MA20: | 3.003 | |
| MA50: | 3.049 | |
| MA100: | 2.894 | |
| MAexp7: | 3.053 | |
| MAexp20: | 3.022 | |
| MAexp50: | 2.992 | |
| MAexp100: | 2.917 | |
| Price / MA7: | +4.45% | |
| Price / MA20: | +5.49% | |
| Price / MA50: | +3.90% | |
| Price / MA100: | +9.47% | |
| Price / MAexp7: | +3.77% | |
| Price / MAexp20: | +4.83% | |
| Price / MAexp50: | +5.88% | |
| Price / MAexp100: | +8.60% |
News
The latest news and videos published on CECONOMY AGINH O.N. at the time of the analysis were as follows:
- EQS-Adhoc: CECONOMY AG: CECONOMY specifies outlook for the business year 2023/24
- EQS-News: CECONOMY AG: FY 2021/22 - Sales above previous year, adjusted EBIT in the upper range of the guidance
- DGAP-Adhoc: CECONOMY AG: CECONOMY AG updates outlook for the financial year 2021/22
- DGAP-News: CECONOMY AG: Closing of transaction with Convergenta expected for early June 2022
- DGAP-News: CECONOMY AG: EGM paves the way for successful further development
About author
Online


Add a comment
Comments
0 comments on the analysis CECONOMY AGINH O.N. - Daily